Posted on February 26, 2026
By Tom Hopper at MHP’s Center for Housing Data
This research is part of MHP's Coordinated Commonwealth initiative, which knits together policy priorities across housing, land use, climate, environmental protection, transportation, and economic health.
In this report, you'll learn:
- Housing is the dominant land use across Massachusetts, covering more than one-third of all land across the Commonwealth (36.3 percent)
- Water/sewer and transit infrastructure has supported more efficient residential land use and a greater diversity of housing typologies, though there are remaining opportunities for denser housing. Average housing density for areas with infrastructure is 8.7 homes per acre, compared with just 0.48 homes per acre in areas without infrastructure. While this is directionally appropriate, 8.7 homes per acre is not very dense overall, and roughly 29 percent of homes in areas with both water/sewer and transit infrastructure are single-family.
- Places with less infrastructure exhibit less sustainable, more car-dependent land use patterns. Nearly 75 percent of all land used for housing lacks water/sewer connections and transit access, yet less than one quarter of homes are in these areas. Residents in these locations tend to live far from other uses and are dependent on cars for mobility.
- Most small multifamily and "missing middle" residential properties were built a long time ago in older, more urban communities. Few developments of this type were built in recent decades.
- A better sense of the capacity of our infrastructure would support responsible and sustainable planning for much-needed new housing development in Massachusetts. This assessment of infrastructure should inform comprehensive state and regional planning that balances priorities across housing, climate/environment, and transportation sectors.
Introduction
Massachusetts residents understand the need for more housing across the Commonwealth. A 2025 survey conducted by MassINC revealed housing is the top concern for voters, with 71 percent favoring affordable homes over defending “neighborhood character,” 63 percent expressing that producing homes is more important than retaining local control over housing types, and 81 percent supporting legislative efforts that would make it easier to build a higher volume and range of housing options.
These survey results indicate both good and bad news. It is bad news that housing outcomes are troubling enough to become the top concern for voters. It reflects the hardships that result from inadequate and unaffordable housing options: cost burden, eviction, foreclosure, and homelessness. Even for residents who are not in precarious housing arrangements, a lack of abundant and attainable housing choices makes it difficult to move to a suitable home as needs shift or major life changes occur. This includes young adults looking to move out on their own for the first time, people looking to move in with a significant other or grow their family, people with disabilities looking for an accessible home, and older adults looking to downsize and be closer to amenities, services, or family.
The good news is this poll indicates a broad and growing constituency for change. Combined with the successful implementation of recent state policies such as the Housing Choice Initiative, the MBTA Communities Act, and the legalization of accessory dwelling units (ADUs), this shift in public sentiment toward pro-housing measures should be seen as a directive for further action.
There are plenty of ideas on the table. For example, in February 2025 the Unlocking Housing Production Commission (UHPC) released recommendations for reducing barriers and costs related to multifamily housing development. This governor-appointed commission of experts studied constraints to development and recommended a series of actions that would accelerate housing production in Massachusetts. The report, titled “Building for Tomorrow,” includes over 50 policy recommendations across four interconnected themes: updating land use and zoning practices; streamlining regulations, codes, and local permitting; economic incentives and workforce development in the housing industry; and bolstering statewide planning and local coordination.
Our team at the Center for Housing Data was particularly intrigued by the report’s recommendation to explore statewide upzoning for denser multifamily housing, with higher requirements for areas served by water and sewer infrastructure. The report recommends the Commonwealth allow two-family homes on all residential lots and four-family homes on all residential lots with water and sewer infrastructure. This recommendation is similar to a proposal in the "YIMBY" bill currently being considered by the legislature, which if passed would legalize three-family homes on all residential lots and multifamily structures of at least five units on lots served by sewer.
These proposed policies made us wonder: how are we currently utilizing land in relation to water, sewer, and transit infrastructure? How do we plan for our future housing needs based on these spatial relationships?
Data Overview
To answer these questions, we need information on the location of infrastructure and the location, type, and density of development across the entire Commonwealth. Below is a summary of the data used to develop our analysis. For details on the sources used and methods applied, scroll to the end of the article.
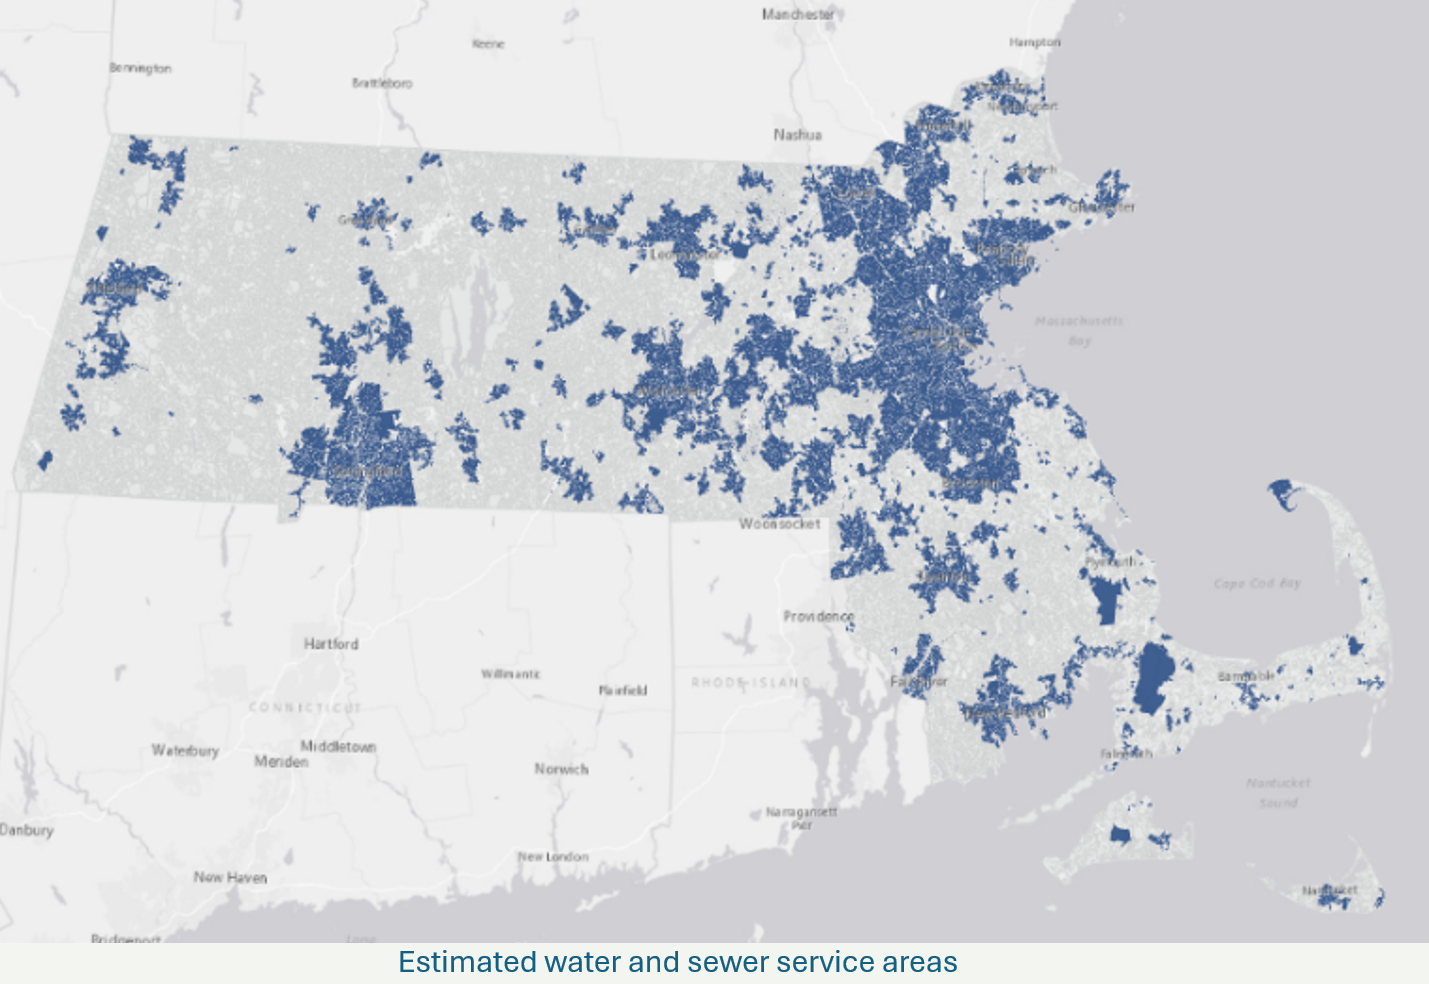
Water and sewer service. We define water service as public, piped water service, rather than water available from a well or private system. This data is available from MassGIS, using data generated by the Massachusetts Department of Environmental Protection (DEP). We define sewer service based on areas served by either a public or private piped system rather than a well. Properties not within estimated sewer service areas are assumed to use a septic system for waste treatment and therefore do not have sewer service.
The adjacent map highlights locations that are estimated to have both water and sewer infrastructure. These services are available across a substantial part of eastern Massachusetts and parts of the Pioneer Valley with smaller pockets scattered across other parts of the state. While a more granular analysis might differentiate between places that have just one of the two services (water or sewer but not both), our approach only considers places with both services to be connected to water/sewer infrastructure.
Proximity to public transit service – For this analysis, we include all MBTA train and trolley stops (including both commuter rail and subway service) as well as bus stops that are part of one of the 15 Regional Transit Authority (RTA) systems, including the MBTA. Ferry service and private, corporate, and institutional transportation services are not included. The adjacent map shows the location of rapid transit, commuter rail, and bus stops across the state. Properties that fall within a half mile of a transit stop are considered to have transit access.
Current property uses, housing unit counts, and residential density – For information on the quantity, type, and density of housing, we leveraged our own dataset from Residensity, our land use and housing explorer. This dataset is built by combining multiple data sources to standardize property uses and estimate housing units and density for every parcel in Massachusetts. The underlying sources include statewide parcel and assessing data and statewide address data that are collected and maintained by MassGIS.
Land Use and Infrastructure Dynamics
With every parcel in Massachusetts coded by both transit and water/sewer availability, we can now summarize land across the Commonwealth by current use and dig into the type and density of housing in areas with differing infrastructure.
The following graphics are called "treemaps," where each rectangle is a scale representation of land across Massachusetts, sort of like a rectangular pie chart. We’ve used treemaps for this exercise because they are an intuitive way to view breakdowns of a defined quantity or area, such as all land in Massachusetts in our case. In this chart, bigger rectangles represent more land, smaller rectangles represent less land, and the relative scale is true to real world proportions. Comparing the size of different rectangles, therefore, helps us understand differences in land use across the Commonwealth.
Before we factor in infrastructure access, let's begin with a broad look at the total land area of the Commonwealth, categorized by land use. The total area of the below treemap represents all Massachusetts land. Each labeled rectangle represents the proportion of land consumed by the associated use.
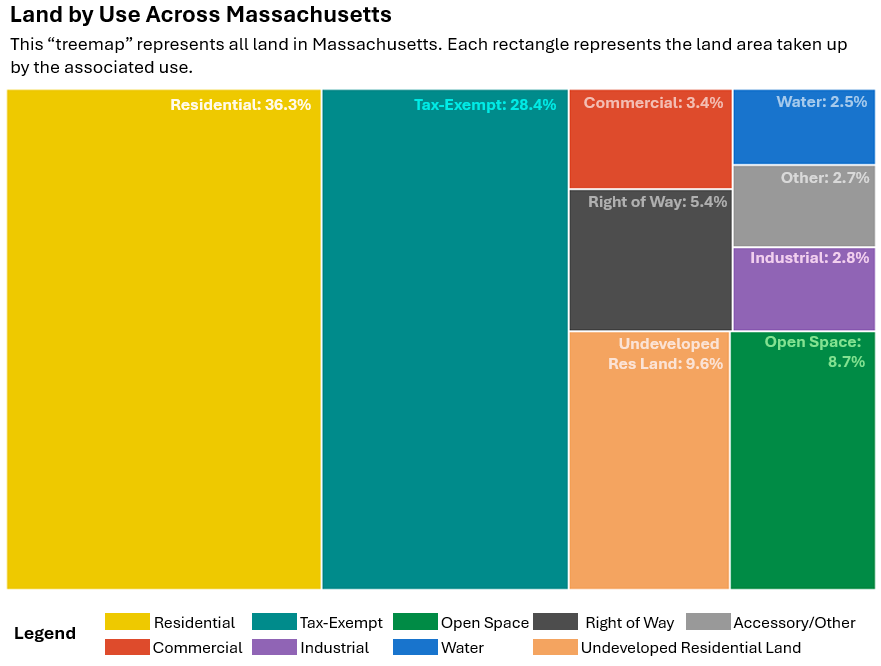
Over one-third of Massachusetts land is dedicated to residential uses (36.3 percent), as represented by the large yellow rectangle in the treemap. Properties grouped into this category include all active residential uses, meaning they are developed and currently used for residential purposes. We use more land for housing than for any other purpose, and this means the way we plan, develop, and provide access and services to housing is a major driver of outcomes across the Commonwealth. Over the course of this report, we’ll dig deeper into residential land use, including analysis of density, form, and year built.
The second largest category of land use in Massachusetts is tax-exempt properties (28.4 percent of land). This includes government property, including both developed property such as town halls, public schools, libraries, fire stations, state and federal properties, and other public buildings, as well as tax-exempt open space properties such as parks and conservation land. The tax-exempt category also includes property owned by institutions that are exempt from property taxes, including religious and charitable organizations.
Since this land use category includes a diverse range of property and ownership types, there can be a lot of variation in the data across communities. While the data makes it possible to distinguish undeveloped tax-exempt parcels from those that are developed, this preliminary analysis did not take that step. Readers should understand there is likely ambiguity and overlap between this land use category and the open space category (visualized in green in the treemap).
Nearly 10 percent of Massachusetts land is coded as "undeveloped residential land." This land use category sounds like a promising resource for future housing development. However, many of the parcels grouped into this category may not be developable at all and have been assigned values such as “undevelopable residential land,” “potentially developable land,” or simply "residential land" by local assessors. This is an often used but inconsistent set of land use categories that may or may not be an accurate assessment of the parcel’s developability. Therefore, this land use category should be interpreted with caution.
A significant amount of Massachusetts land is coded as open space (8.7 percent of the state). Due to the aforementioned ambiguity within the tax-exempt category, this is likely a low estimate of actual open space. The parcels in this category are dedicated solely to open space and recreational uses. It is important to note that this category does not include undeveloped space on parcels dedicated to other uses, such as lawns or forested areas on residential, commercial, industrial, or any other property types.
Right of way, which includes roads and railways, consumes 5.4 percent of land across Massachusetts. Another 2.5 percent of land is covered by water and wetlands. Other uses, including commercial (3.4 percent), industrial (2.8 percent), and other uses (2.7 percent) take up the remaining space in the Commonwealth. "Other" land uses include uses that did not fit into other categories, such as parcels with accessory structures or parking lots.
This statewide treemap demonstrates that residential uses are dominant across Massachusetts. Public and non-profit purposes (tax-exempt land), open space, and right of way consume a significant amount of land as well, and this finding likely necessitates further investigation since there is a wide variety of uses within these categories, particularly the "tax-exempt" category.
Building on this statewide look, we can now categorize land by access to water/sewer and transit infrastructure. The adjacent set of four treemaps is a further breakdown of the prior statewide graphic, each one representing the land falling within each infrastructure access category. Just like in the first treemap, the relative sizes of rectangles in this graphic are true to real-world proportions.
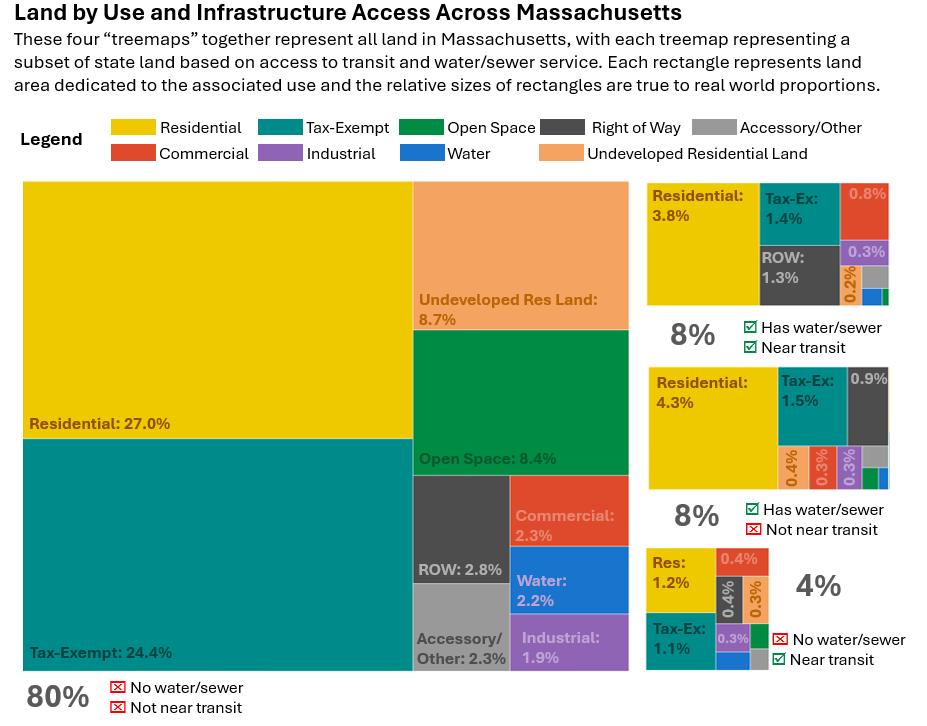
The most obvious difference across the four treemaps is scale. The majority of land in Massachusetts (80 percent) does not have piped water and sewer connections and is not in proximity (0.5 mile) to transit. The table below provides a detailed breakdown of how land is used in parts of the state without water/sewer or transit service.
Most of our residential land is in these areas (74 percent of all residential land is in these areas, consuming 27 percent of statewide land). These residences are in car-dependent locations and likely have wells and septic systems to meet water and wastewater needs. As we'll see later in this report, although most of our residential land is located in these areas, they tend to be sparsely populated and considerably less dense than parts of the state that benefit from infrastructure access. Despite consuming a large amount of land, these areas house a relatively small proportion of households.
Tax-exempt land without infrastructure represents another 24.4 percent of state land, including government-owned properties, conservation land, religious institutions, and other untaxed entities. There is also a significant amount of undeveloped residential land (8.7 percent) and parcels designated as open space (8.4 percent). Note that there are open spaces in other categories, too, including parks and protected areas that may appear in the tax-exempt category, so this “open space” category is not necessarily a good representation of total natural land or recreational areas.
While other uses in areas without infrastructure, such as commercial (2.3 percent) and industrial (1.9 percent) represent smaller proportions of the state, they still comprise hundreds of thousands of acres of land.
Just 8 percent of land benefits from water/sewer infrastructure and proximity to transit service. This is important context for policies aimed at sustainable land use and the encouragement of denser development patterns in smart locations. Without significant expansions in infrastructure service, these areas will continue to be our best bet for achieving these policy goals.
The table below provides a detailed breakdown of land use in areas that benefit from both water/sewer service and transit proximity.
Nearly half of the land in these higher infrastructure areas is residential (46.6 percent), but these residential properties only represent about 3.8 percent of land statewide. The presence of infrastructure and proximity to transit make these highly desirable locations, and this perhaps explains the relatively higher proportion of land used for housing. Residents living in these areas can be less dependent on cars for mobility, and as we’ll see later in this analysis, developments in these neighborhoods tend to be significantly denser and more varied in typology.
Tax-exempt properties represent 16.8 percent of land with both types of infrastructure (1.4 percent of state land), and right of way (roads, rail lines) represent 16.4 percent of land in this category (1.3 percent of state land).
Right of way consumes a high percentage of land in places with both transit and water/sewer infrastructure, compared to lower infrastructure areas. These places are generally denser with smaller lots, smaller blocks to aid in walkability and circulation, on-street parking, and wider streets and roads to accommodate more traffic. These rights of way also host the transit, water, and sewer infrastructure that enables denser development patterns.
We can also observe some increases in the commercial and industrial land use categories, compared to statewide levels. Commercial uses represent 9.4 percent of land in areas with access to both our infrastructure categories, and industrial represents 4.2 percent. This demonstrates clustering and density of these use types in areas with infrastructure access. This is a sign that colocation of different uses in highly resourced areas is common, and infrastructure is an attractive and important factor in making these mixed-use neighborhoods possible.
Another 8 percent of land across the state has piped water and sewer service but is not within half a mile of a transit stop. The table below provides a detailed breakdown of land use in areas that benefit from water/sewer service but are not in proximity to transit.
Housing remains the dominant land use in these locations, and at a higher proportion than seen in our other infrastructure categories; over half of land in these areas is residential (53.9 percent), though this only represents about 4.3 percent of land statewide. As we saw with the prior infrastructure category, the presence of water/sewer service appears to be associated with a greater emphasis on residential land use. This makes some sense, given the relatively high water and waste volumes associated with residential uses, and the propensity for developers to choose locations with these services.
Commercial, industrial, and right of way are also more common land uses in these places than they are statewide. This demonstrates that water/sewer service helps support a variety of development types and density and requires more roadways to host this infrastructure and manage mobility and circulation of people.
Finally, the remaining 4 percent of Massachusetts land does not have piped water/sewer access but is within half a mile of a transit station. The table below provides a detailed breakdown of land use in areas that lack water/sewer service but are in proximity to transit.
In these places, just under 30 percent of land is residential, representing just 1.2 percent of statewide land. Unlike areas with water/sewer infrastructure, these parts of the state tend to have less emphasis on residential uses.
Land use in this category closely mirrors statewide land use across most categories, with higher levels of commercial, industrial and right of way land use. This indicates that transit access is perhaps supporting a more diverse set of uses in these locations, but with less emphasis on housing. As we’ll see in the next section, housing in these neighborhoods tends to be less dense than in areas with water/sewer service, despite having good transit access. Given how important transit-oriented housing is in increasing mobility and access for residents who live in proximity to service, a deeper exploration of these neighborhoods should explore why housing is not more prevalent near these transit stations and examine how the lack of water/sewer infrastructure may be an obstacle for production.
Housing Density and Infrastructure
While the treemap graphics in the prior section help us understand proportional land uses across the state, they do not communicate how densely residential properties are developed on that land and how that density relates to infrastructure. The bar chart below compares the land area dedicated to residential use to the number of homes on that land for each of the infrastructure categories we’re exploring. The second bar chart displays average residential density for each of our four infrastructure access categories. These charts differ from the graphics in the prior section in that they represent only land used for residential purposes, not all land.
These visuals confirm a clear, positive relationship between density and infrastructure. While just 10.4 percent of residential land benefits from both water/sewer and transit access, 56.4 percent of homes are located in these areas. This generates an average net density of 8.7 homes per acre, significantly higher than areas without infrastructure. While there is certainly variation between infrastructure-rich neighborhoods in terms of housing stock and density, these results indicate alignment between more intensive residential development patterns and the presence of infrastructure. However, just because these neighborhoods are relatively denser, it does not mean they are adequately dense or achieving a level of efficiency commensurate with the level of infrastructure access they benefit from. There are certainly opportunities to increase the volume and density of development in these locations.
Conversely, while 74.4 percent of residential land is not served by water/sewer or transit, only 22.5 percent of Massachusetts homes are sited in these locations. These parts of the state have a very low average residential density of about 0.48 homes per acre. While there are certainly pockets of higher density in these neighborhoods, the data indicate sprawling development patterns with a lot of separation between neighboring residences. Low-density residential patterns like these are incredibly inefficient. Sprawling neighborhoods house fewer people on large amounts of land and residents tend to be entirely dependent on cars for mobility needs. These patterns have an adverse impact on traffic congestion, carbon emissions, and land consumption.
Within areas served by only one of the two infrastructure types, it appears that water and sewer infrastructure have a stronger relationship with residential density (11.8 percent of statewide residential land, 17.5 percent of homes for an average density of 2.37 homes per acre). Areas near transit service but without water/sewer access have a lower average net density of approximately 1.66 homes per acre. This is a very low level of residential density for neighborhoods served by transit and signals the need for further research and potential policy. While septic systems and other waste disposal solutions are unable to support development at density levels as high as piped water and sewer service can, it does not mean there isn’t development and redevelopment potential that increases housing stock in these locations. Municipal zoning and land use policies may be unnecessarily restricting multifamily housing or creating unreasonable standards for septic systems.
Not only is the total housing stock generally denser in areas with infrastructure, but the density and efficiency of the same development type tend to be higher in areas with infrastructure access (e.g. single-family homes in places with infrastructure tend to be more dense than single-family homes in places without). The following graph shows that for each housing type, properties with infrastructure access tend to be significantly denser. Unsurprisingly, our densest developments are connected to infrastructure, with average housing densities for multifamily housing of over 20 homes per acre.
Even single-family homes in infrastructure-rich areas can be denser than multifamily properties in areas lacking infrastructure. The average density for a 50+ unit property in areas without infrastructure is just 3.9 homes per acre, while single-family homes in areas with transit and water/sewer infrastructure achieve densities nearly that high on average, 3.7 homes per acre.
This demonstrates the value of using density as a metric for comparison. While much of the discourse around housing development has focused on multifamily versus single-family, it is important to note that a dense neighborhood of single-family homes on small lots can be a more efficient approach to land use than a large multifamily property on an enormous lot that is far away from infrastructure. If you would like to explore residential density in your own neighborhood, or anywhere in Massachusetts, check out our web explorer, Residensity.
Of course, many places that restrict development to single-family homes also require large lot sizes, effectively prohibiting anything but sprawling and inefficient single-family development patterns. Additionally, building single-family homes on small lots in places served by infrastructure is not often a good use of this highly resourced land; even if these homes are dense relative to some far-flung multifamily developments, it does not mean they are achieving a level of density commensurate with provided services and amenities.
Housing Typology and Infrastructure
Although density is an important way to evaluate land use, the mix of residential scale (number of units) and typology (single-family, multifamily) is still an important consideration for policy analysis.
Across our four infrastructure categories, the most variation in housing type exists in areas with both transit and water/sewer infrastructure. The graph below shows the highest volume of multifamily housing in areas with infrastructure, including much sought after “missing middle” housing types. These small to mid-scale multifamily housing developments can generate significant levels of residential density while maintaining smaller building profiles and varied frontages that many feel capture a more traditional neighborhood feel.
Although the variation in housing typologies is notable in places with infrastructure, there is still a considerable amount of land dedicated to single-family homes in these highly resourced areas. These may be prime locations for redevelopment or the addition of accessory dwelling units (ADUs). The presence of water and sewer infrastructure in these neighborhoods would help support ADU feasibility and could create infill in places with existing density and more opportunities for car-free living. However, single-family homes in places near transit tend to be on smaller lots. Policies driving ADU production in these places should be careful to set requirements that work for smaller lots in denser neighborhoods (for more on ADUs in Massachusetts, check out the administration's page, and then check out some newer happenings on MHP's website).
Meanwhile, the housing landscape across the three other infrastructure categories is dominated by single-family homes. In areas with either water/sewer service or transit service, this points to missed opportunities to take advantage of the capacity and opportunity these infrastructure systems present. Placing more homes in these resourced areas is our best bet for increasing our housing stock while simultaneously making progress on sustainability, reducing congestion, and maximizing public investments.
While places without either transit or water/sewer are not utilizing these particular resources, it does not mean they are not supported by any infrastructure. There is a cost associated with providing utilities, high speed internet, and roadways to sparsely populated areas; the more sprawling our development patterns are, the higher these costs. Additionally, the car-dependence generated by these spatial patterns imposes a cost in terms of increased carbon emissions and congestion, both of which have been flagged as major policy problems in Massachusetts.
Housing Typologies by Year Built and Infrastructure Access
So, why do we have more diversity in housing types in places with infrastructure? Certainly, some of this pattern is due to the ability of infrastructure to support higher density places and create more capacity on a relatively small amount of land. However, there is also a strong historical dimension to consider: much of our denser housing and infrastructure is in older cities and suburban communities that predate mass suburbanization. The chart below breaks down housing developments by number of units across the state and displays the distributions of these developments by year built.
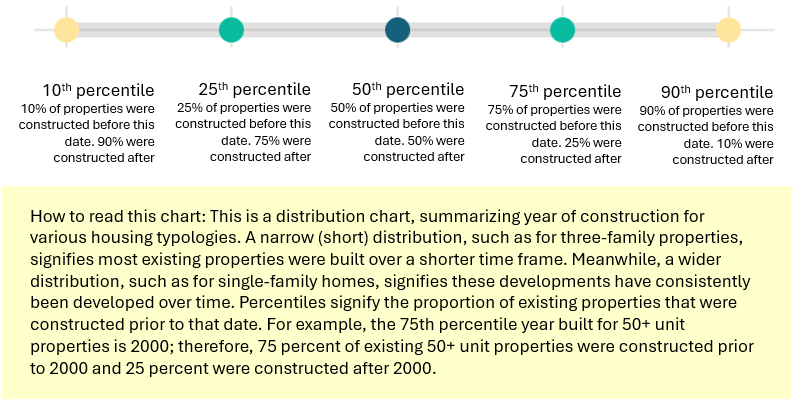
By visualizing the data this way, we can see the complex historical dimensions of our housing stock. The vast majority of two- three- and 4–8-unit structures were constructed many decades ago (at least 75 percent of that stock was constructed before the 1920s/1930s). Since that time, new development activity has been dominated by a combination of single-family homes and larger multifamily properties.
As mass suburbanization and white flight occurred post-WWII and then continued in fits and starts through the 1980s and 1990s, there was a shift toward single-family development in increasingly distant and car-dependent suburbs. Alongside this growth in single-family suburbs, moderate-scale multifamily housing (9-50 units) was still developed consistently through the twentieth century. Though, notably, the distribution for larger multifamily housing (21-50 units and 50+ units) shows a significant proportion of those properties were constructed in more recent decades.
This exploration of year built provides evidence we have developed more densely in alignment with infrastructure, though this relationship has certainly been dynamic over time. Many of the places with infrastructure are older urban centers, where infrastructure may have originally been developed somewhat organically in coordination with population growth and housing demand. The modern focus on single-family homes and large multifamily development suggests we should not expect to see considerable growth in mid-scale multifamily housing typologies in the near future unless there are major shifts in zoning and feasibility for these projects.
This is an important consideration, especially in some of our Gateway Cities and other urban locations where new development is often not as financially feasible or profitable. These cornerstone communities are home to a large proportion of our population, have the most diversity in housing stock, and are often the best positioned relative to transit, water/sewer, and other infrastructure. An important policy goal should be to preserve affordability and socioeconomic diversity in these communities while promoting investment, development, collocation, and the development of denser housing.
Similarly, small- and moderate-scale housing often seems a great fit for suburban communities looking to create walkable downtowns, main streets, and village centers. If there are zoning restrictions or financial feasibility barriers, however, these structures can't be built. Instead, we have seen mostly single-family and larger multifamily development. In some cases, we have seen many large developments sited on the periphery of suburban communities
rather than integrated into existing town centers where they would be in close proximity to other uses and amenities. In these cases, while a community has added multifamily housing it may be distant or disconnected from the rest of the community.
Discussion
It is good state and regional policy to make the most of infrastructure investments and create walkable and dynamic mixed-use communities where these public assets align. Coordinating housing policy with these systems poses our best chance of addressing the housing crisis while boosting transit ridership, reducing car usage and carbon emissions, and managing environmental impacts. Our analysis indicates that Massachusetts’ prevailing development patterns demonstrate more efficient land use in places with infrastructure while also signaling there are remaining opportunities to concentrate development in these areas.
It is directionally good that we have more residential density in places with more infrastructure, since infrastructure allows us to support density. However, we know that there are many neighborhoods with transit access that have exceptionally low levels of residential density (for more on MHP's exploration of density patterns, check our map explorers, TODEX and Residensity). Our analysis boosts the rationale for the kind of coordinated, statewide upzoning around infrastructure mentioned in the introduction of this report; if we want to increase our housing stock, these geographic areas pose our greatest chance of doing so in a sustainable way.
Places without infrastructure are not off the hook for housing development, though. While very high levels of density may not be supportable in these locations, there is a need for multifamily housing in every community, and most communities have suitable locations for these homes, such as a main street or village center. At the appropriate scale, properties can be developed and supported without piped water and sewer. Multifamily housing in smart locations where other community assets are accessible creates a more active community that is more walkable and dynamic, requiring fewer car trips even without transit service. Greater housing diversity in terms of type, size, and price also facilitates greater socioeconomic diversity, allowing a broader array of community members to thrive.
Conclusion: A Stronger Understanding of Infrastructure Health and Capacity will Support Coordinated Planning
The presence of infrastructure is one thing, but the capacity and health of that infrastructure is another. If we are to depend on infrastructure as the backbone for development, we must make the necessary investments to ensure its long-term viability and minimize the risk of infrastructure failing.
Given how much infrastructure funding comes from the federal government (in fact, federal funding has contributed to much of our infrastructure in the first place) and given how unlikely large federal infrastructure funding is in the near term, any major expansions or improvements in service may prove difficult in the short-term. Still, even without a federal infusion of capital, there are actions Massachusetts can take to buoy our infrastructure and plan responsibly for the housing needs of current and future residents. Here are a few suggestions for how we can more confidently plan for housing and infrastructure at the state level.
- Assess where existing infrastructure is already adequate to support needed development. Without a comprehensive, statewide understanding of where infrastructure is strained and where we have excess capacity, it is impossible to plan proactively for the future. With better knowledge of infrastructure capacity, researchers and policymakers would be able to more easily identify and take advantage of development and redevelopment opportunities in these neighborhoods.
- Once priority investments and land use goals are set and there is good information on the location and health of our infrastructure, the Commonwealth may need to find ways to pay for these infrastructure investments. Existing infrastructure programs, such as MassWorks and HousingWorks should align awards with regional and state land use priorities. New programs and funding may be required, and the information gathered through the assessment process described in the bullet above should be leveraged to advocate for these resources, whether appealing to the federal government, reallocating state resources, or through revenue generation via a surcharge or tax. Mechanisms such as tolling, congestion pricing, or gas taxes might be worth particular focus, given that they would disincentivize vehicle trips while providing resources for sustainable, transit-oriented development.
- Create a comprehensive planning function within state government, such as an Office of State Planning. By prioritizing land use intensity where infrastructure exists, we will be able to better balance development with other priorities, such as conservation and climate resilience. This is the type of land use planning that is commonly done by an Office of State Planning in other states. The lack of such an entity in Massachusetts has been an impediment to responsible state planning and has prevented the Commonwealth from guiding investments and resources to places where transit, water, sewer, density, and development opportunities are in alignment.
- Exclusionary zoning laws that impede multifamily production in highly resourced areas are dampening supply where we would most like to see it. Local bans on denser, more efficient housing types have implications for the entire regional and state housing ecosystem and hinder our ability to coordinate housing policy with transportation, climate, and environmental policy. The recommendation cited in the introduction of this paper from the Unlocking Housing Production Commission and the language in the YIMBY bill related to upzoning near water/sewer service are aligned with this framework. Further analysis should be done to identify the neighborhoods and municipalities that are failing to zone appropriately relative to state resources and investments in infrastructure.
- In locations with suitable water and sewer infrastructure and good transit service, strategies to enhance the service of that transit should be explored. Higher frequency and bidirectional service should be pursued to encourage higher transit ridership in places where housing density is high or increasing. Lowering other barriers to transit ridership should be explored as well, including expansions in reduced fares for low- and moderate-income households.
- Others should join us in using this exploratory report as a springboard to answer additional questions about land use. Here are a few ideas based on the content of this report:
- Explore and understand why non-sewered areas near transit aren't achieving even moderate density levels.
- Better categorize tax-exempt uses and open space and add nuance to our understanding of public and non-profit land ownership.
- Expand this analysis to cover other critical infrastructure systems, such as utilities and high-speed internet.
- Take a more granular look at low-density properties in high-infrastructure neighborhoods to illuminate opportunities for more permissive zoning and denser development.
- Compare prevailing density levels to optimum levels. This brief looked at relative levels of residential density to draw comparisons between neighborhoods with different levels of infrastructure. However, just because neighborhoods served by our selected infrastructure categories tend to be denser, it does not mean there aren’t ample opportunities to create additional density and create more active, concentrated, vibrant neighborhoods in these communities.
Where we build housing is important. We’re living with the consequences of prior land use and development decisions that have generated patterns of segregation, auto dependence, and environmental degradation. Our state policies must evolve from parochial approaches that leave solutions to individual municipalities and instead plan for housing, transportation, and climate on the larger geographic scales appropriate for these systems. Our ability to create abundant housing options, fast and reliable transit systems with high ridership, and a sustainable and resilient Commonwealth depend on it.
Data and Methods
Water Service – For this analysis, we define water service as public, piped water service, rather than water available from a well or private system. We are utilizing the Department of Environmental Protection’s (MassDEP) estimated public drinking water system service boundaries, available from MassGIS. This analysis includes both Public Water Systems and Non-Transient Non-Community Public Water Systems, per Mass DEP definitions. Our analysis removes any service areas DEP has marked as inactive or declassified. While service areas represented in these data are estimated, this is the best and most comprehensive source for water service in the Commonwealth.
Sewer Service – DEP publishes geospatial data representing the estimated sewer service areas for both public and private systems. The data can be viewed on MassMapper, a map explorer offered by MassGIS and a direct download of these layers and the background and metadata associated with them can be accessed here. As with the water service information, these data represent estimated service areas for sewer infrastructure, so exact boundaries of sewer service may differ slightly. This analysis includes both publicly and privately-owned treatment networks, per Mass DEP definitions.
To match service to properties, we intersect water and sewer service areas with tax parcels. Parcels with a center point located within both water and sewer service areas are coded to have water/sewer service. Parcels designated as right of way and water features are split where they cross a water and sewer service area boundary, and the portions of these features that fall within both service areas are coded as land within water and sewer service areas.
Proximity to public transit service – For this analysis, we include all MBTA train and trolley stops (including both commuter rail and subway service) as well as bus stops that are part of one of the 15 Regional Transit Authority (RTA) systems, including the MBTA. Ferry service and private, corporate, and institutional transportation services are not included.
Parcels with a center point within a half mile of any transit stop were coded to have transit service. Right of way and water features are split where they crossed the half mile radius of a transit stop, and the portions of these features that fall within the half-mile radius are coded to be within the transit service area.
Current property uses, housing unit counts, and residential density – For information on the quantity, type, and density of housing, we are leveraging our own dataset from Residensity, our land use and housing explorer. This dataset is built using custom methodology that combines multiple data sources to standardize property uses and estimate housing units and density for every parcel in Massachusetts. The underlying sources include statewide parcel and assessing data and statewide address data that are collected and maintained by MassGIS. Parcel center points are used to determine intersections with infrastructure service areas. This parcel data is also the source for right of way and water.
For additional information about this brief, please contact Tom Hopper.
For more information contact MHP Communication Manager Lisa Braxton, (857) 301-1526.