Posted on February 15, 2023
By Tom Hopper
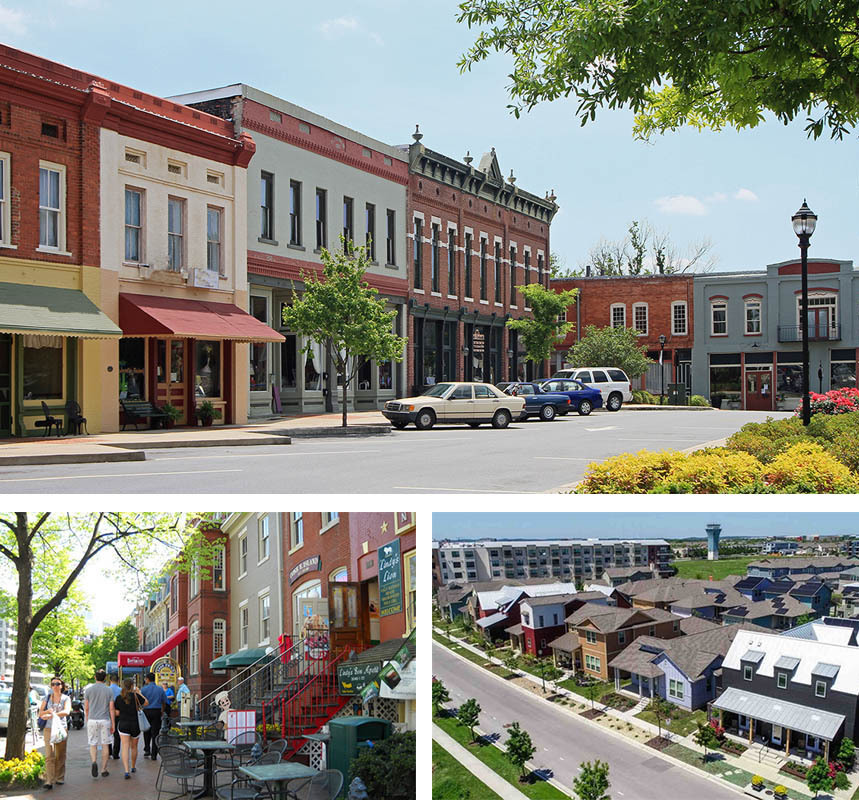
Density can be a polarizing term. For some, the phrase “housing density” conjures visions of blocks of skyscrapers with people crowded into small apartments. The word “density” is even weaponized to drum up fear that multifamily housing is damaging to a community and its residents.
For this reason and many others, this is why the Center for Housing Data created Residensity. We wanted to create a tool that could show that residential density often exists in neighborhoods we love and that we can use this information to create more dynamic neighborhoods where everything we need is nearby.
If one were to perform an intervention on someone who recoils at the mention of density, it might be useful to start off by reminding them that density is just a measurement. Each piece of land has a density we can measure, and there are variations in the shape and form of development that can achieve the exact same residential density on the exact same piece of land in very different ways. In this way, density can be looked at as an important tool for crafting the places we enjoy. Therefore, it’s important to defang the word and attempt to build a better understanding of the role that density plays in shaping the world around us.
That is particularly true for residential density. You can have more variation in size and function within a neighborhood when you build more densely. Having more homes and more multifamily units aids in affordability, especially when paired with subsidies or income-restrictions. Diverse housing options at a range of prices creates a more socioeconomically diverse community.
Plus, other neighborhood features and amenities become easier to support with greater housing density. To have a successful village center, main street, or bustling urban downtown, we need a commensurate level of housing density to complement commercial and others uses. So, underutilized space — especially in places that are served by transit — represents a missed opportunity to establish more great neighborhoods that have high levels of mobility, reduced climate impacts, and the mix and intensity of uses that cultivate a vibrant public realm.
We don’t have good understanding of how density looks, feels
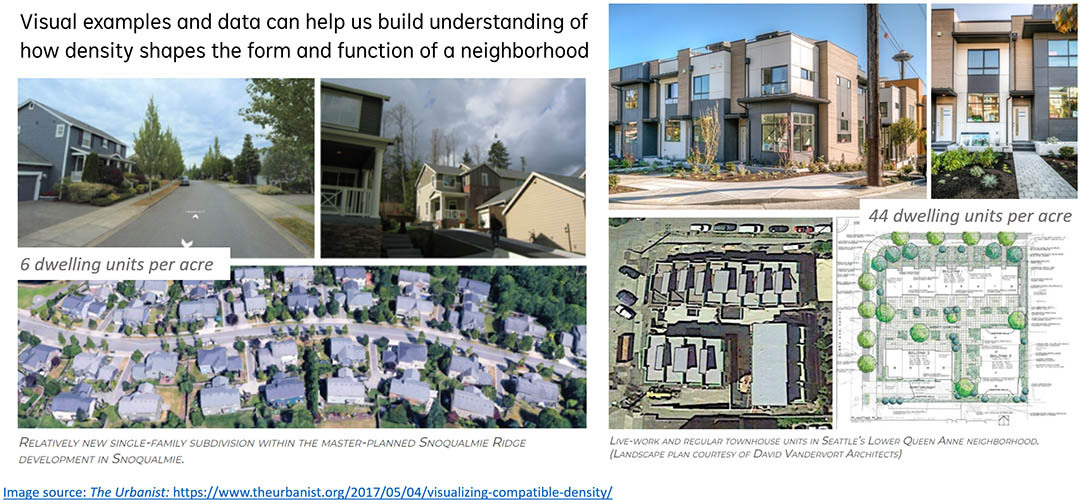
Another reason we think we need to rebuild our relationship with density is that most of us have a poor visual understanding of what different levels of density look like. There are some great websites that are trying to build literacy around visualizing density. The two examples in the image above come from The Urbanist. On the left is a single-family neighborhood with some pretty large homes, but on pretty modest lots that get this neighborhood to a density of 6 units per acre. On the right is an example of a compact set of buildings, only two stories, that contain live-work spaces and is achieving a density of 44 homes per acre.
These examples are helpful, but we think there are reasons why we should have a more user-friendly, comprehensive way to measure and evaluate density anywhere we want.
- If we want to understand density and how it shapes different neighborhoods across the state, we need to be able to measure and evaluate density not just at individual locations, but on the neighborhood level, and using consistent metrics.
- There are also planning needs. If we want to be able to take stock of existing conditions and explore how we can target a certain level of density, such as the levels required for MBTA communities under Section 3A, we need a tool to do that.
- If people have a visceral reaction to the word density, or a certain level of density, we need a tool to show them that we already have residential density in every community in the state in some form, and in many cases we love our denser neighborhoods – places like village centers, main street corridors and other great neighborhoods.
- Finally, where are there missed opportunities? Where can we, as folks working on housing issues, highlight potential for development that works in concert with our planning goals and our neighborhoods, especially relative to transit, climate, and racial equity? Which places could be even better if we used density as a tool to drive those outcomes?
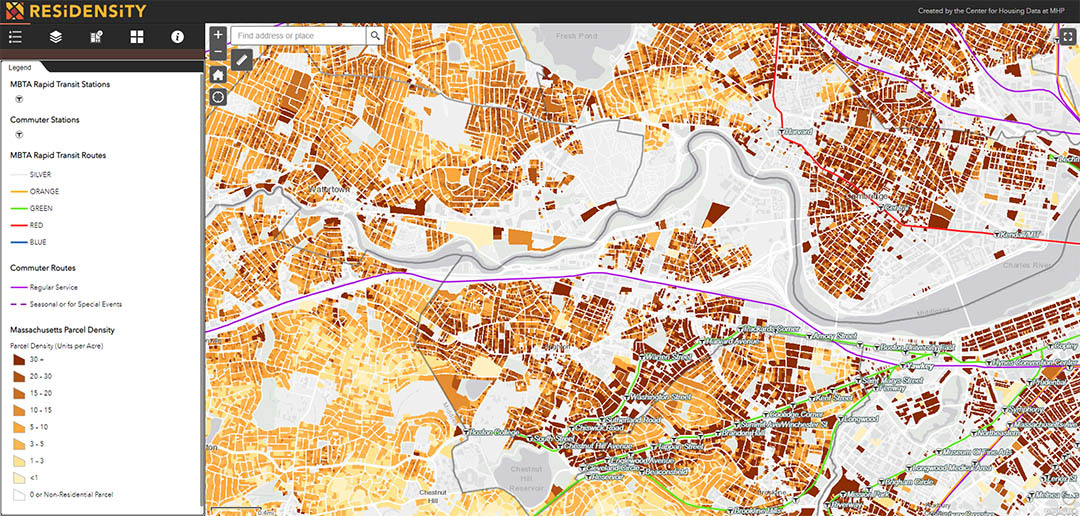
Residensity shows how density can work
For all these reasons, we built our brand new site, Residensity! In the above screen grab, you’re seeing individual residential parcels, color-coded by their housing densities. You can see how density is clustered, how those patterns change, and how they correspond with real world variations in the built form.
Here are a few of the features we’ve built into Residensity:
- Measure residential density anywhere you want.
- We have estimated number of units and residential density for every single parcel in Massachusetts.
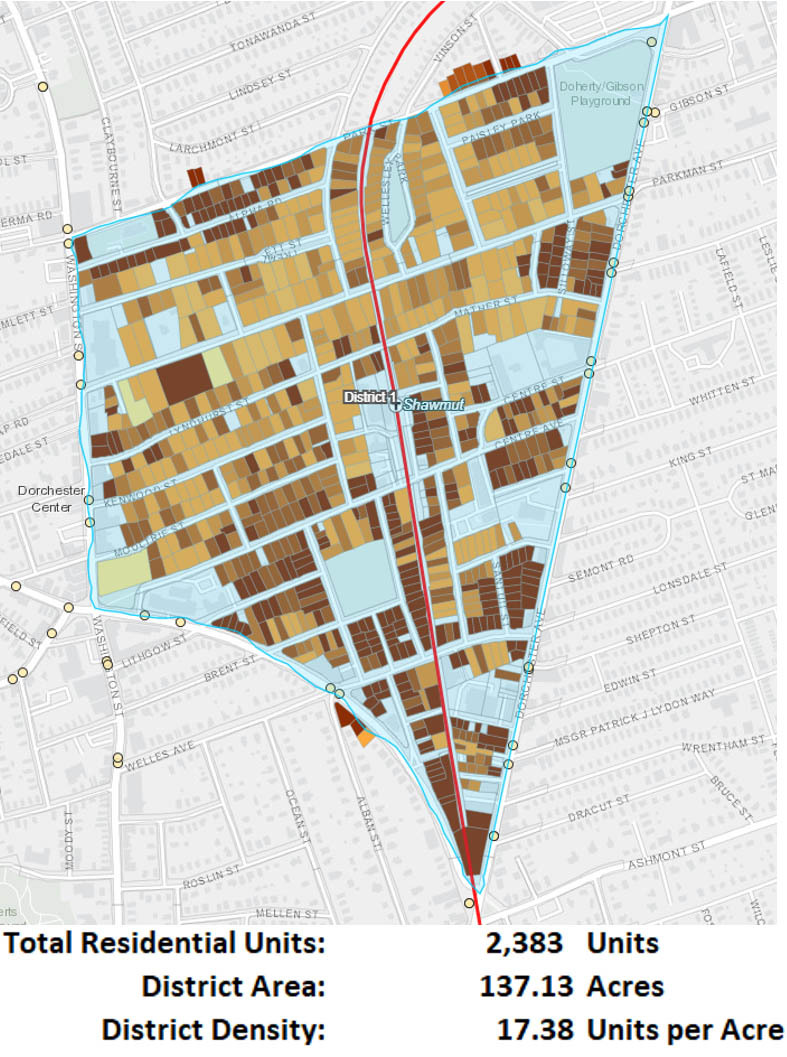
- Draw any district you want on the fly and get aggregate statistics for that district. In the example here on the left I drew a district around my neighborhood in Dorchester.
- Download the parcel and district level data in both tabular form (a csv) or in geospatial form for those who would like to work in GIS.
- Lastly, and this is less of a feature and more of a timing thing, but we wanted to launch something at this particular point in time because there are 175 communities in Massachusetts that are about to figure out their path towards compliance with the new multifamily zoning requirement, and we hope Residensity can play a role in that.
We hope this helps explain why we created Residensity. Please take time to explore the web site and tell us what you think. You can report a data correction or take our user feedback survey. With your help in reporting any inaccuracies, we can refine our methodology and build an even better resource that will help people understand how density shapes great neighborhoods across the Commonwealth.
(Tom Hopper is the Director of Research and Analytics for MHP's Center for Housing Data).