Posted on August 2, 2018
By Tom Hopper, MHP Center for Housing Data
A few weeks back, the Globe published an article by Tim Logan on the relationship between job creation and housing development in the city of Waltham, titled “Live where you work? In Waltham, that’s not so easy.” The thrust of the article is that while Waltham has added a staggering number of jobs (11,000 between 2010 and 2016), the city’s housing production has not kept pace. Workers need places to live, so these new Waltham workers are unlikely to find sufficient housing in the city in which they work. The piece provides a great example of the general disconnectedness we see between economic growth and housing production all across the state.
Reading through Tim Logan’s article, the following paragraph caught the attention of our staff at the Center for Housing Data:
“During the same period those thousands of jobs were being created, the city of 63,000 people – up 3 percent from 2010 – added just a few hundred homes, most of them in two downtown apartment buildings.”
What struck us about this statement is the lack of precision in the number of housing units produced. If we can measure the number of jobs created, how come we can’t get an exact count of the housing units produced in the same time period? Well, it turns out that measuring housing production is actually a pretty difficult task in Massachusetts, particularly because housing decisions are made independently by 351 cities and towns with 351 independent permitting and approval processes. Without an Office of State Planning, there aren’t a whole lot of options for routinely compiling and analyzing these disparate data sources on new production.
But investigating data is what we do, and we saw this as an opportunity to dig a little deeper to see if we could provide a more detailed estimate of the number of units produced in Waltham since 2010. Here we go.
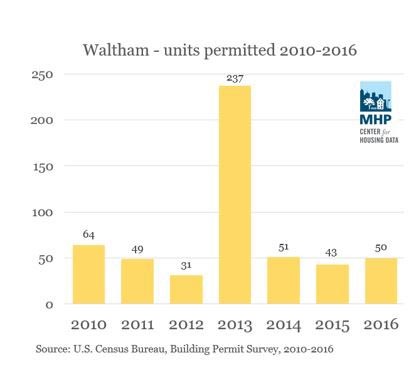
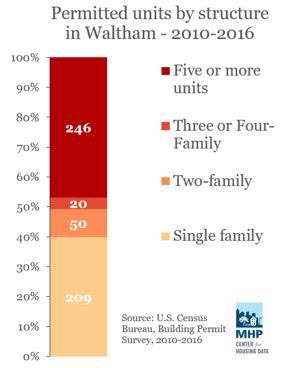
The first stop on the data train was the Building Permit Survey, compiled by the U.S. Census Bureau with help in Massachusetts from the State Data Center, run out of UMass Donahue. According to this dataset, Waltham permitted roughly 525 net new housing units from 2010-2016. This includes a huge spike in permitting in 2013, the result of one multifamily building with roughly 200 units.
The Building Permit Survey data is easily accessible, but it comes with some caveats that impact its reliability and accuracy. One issue is that the data is self-reported by individual towns, and reporting frequency is often less than ideal. Waltham has, for many years, been a fairly good reporter. In the years 2010-2014, Waltham provided complete information. However, in 2015 only six months of permits were reported, and in 2016 the city did not report at all. What happens when reporting is not received? I still have more to learn on this topic, but my very basic understanding is that missing data are imputed by the census bureau based on a combination of factors, including past permitting history of the community, as well as the rate of change in regional permitting totals (feel free to write me and correct this). Needless to say, an imputed count is not as good as an actual count, and it calls into question the accuracy of the 2015 and 2016 numbers in the first two charts.
Another issue with the Building Permit Survey is that even when reporting is good, we can’t tell for sure if the municipality is reporting correctly. Through our work over the past year or so with this dataset, we have found that it is not uncommon for actual counts of new units to differ from those reported on the Building Permit Survey. One prime example has to do with demolitions. The Building Permit Survey methodology requires respondents to report net new units, basically all newly built units minus any units that were demolished. However, in many places, Building Permit Survey reporting is not a high priority task, and this methodology is not always followed perfectly.
Additionally, this dataset includes permitted units, which is different than built units. While our sense here at MHP is that most permitted units do eventually get built, there is definitely a lag between when a permit is issued and when a unit is built. What we are trying to sort out here is how many new units have come online.
So, although the Building Permit Survey is easily accessible, it leaves us wanting for another way to verify housing production levels. Luckily, we found one. The second stop on our data route comes from the municipality's assessing department. MassGIS collects, helps standardize, and compiles tax parcel map files for every city and town in Massachusetts (except Boston, which provides public access to its parcel files separately). Waltham sent an updated parcel map to MassGIS in 2017, so we have a pretty current file to work with. These files provide a wealth of information on the parcel level, including the property’s use (residential, commercial, industrial, etc), as well as more detailed information such as number of stories, owner information, year built, and number of units. This just the information we need for our exploration. So, we popped the data into GIS and did some digging. First, we isolated all of the residential use parcels that have been built since 2010. Here they are:
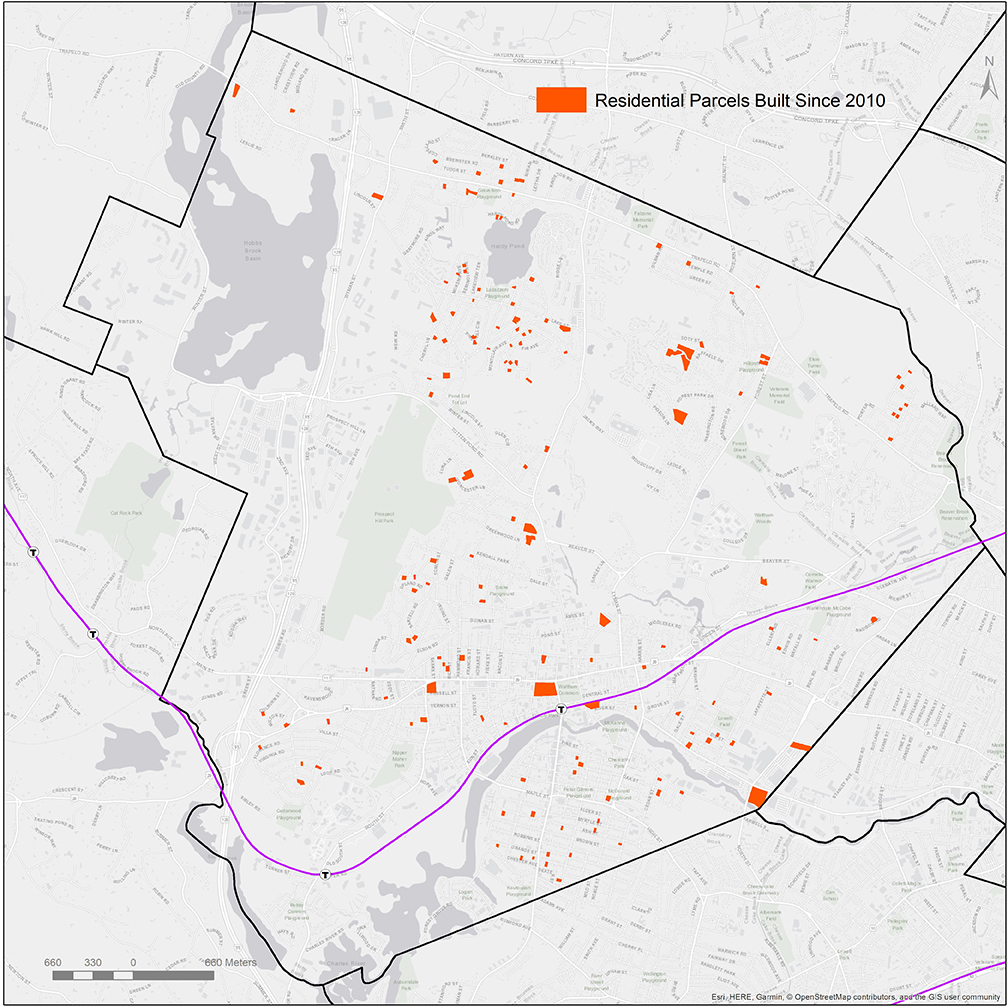
These parcels are pretty well-distributed across the city, with some definite clustering in the northern section of Waltham near Hardy Pond as well as the Main Street area and neighborhood around the commuter rail stop.
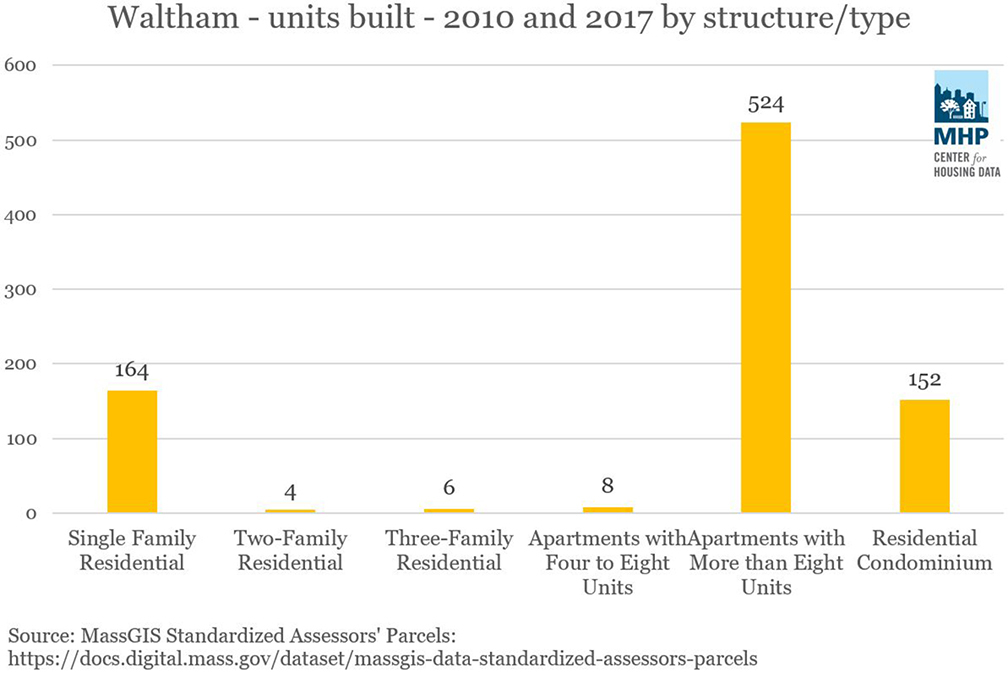
While many of the new units are single-family homes, we can tell from the use codes for these parcels that a very large proportion of the new units are within larger apartment buildings. A significant portion of the new units are classified as “residential condominium,” which is a bit of a problematic designation since it does not explicitly tell us what kind of building these condo units are in. I did a quick scan of these parcels, and it appears that these units are mostly townhouses and garden-style residences.
Those 524 units in larger apartments really come from just three developments, two of which are well-located right by the commuter rail station. One is a luxury apartment building of over 50 units at 431 River Street (Waltham Landing), and the other is over 250 units at 1 Moody Street (The MERC @ Moody & Main). Both are mixed use buildings, and appear to be the kind of dense, walkable housing options that most people would like to see around a transit stop. The third large property is 200 units of apartments called Currents on the Charles, which are billed as luxury units.
In total, the parcel data shows the addition of 858 new units from 2010-2017. Of course, this does not account for demolitions, so the net new housing total for Waltham is likely to be a bit lower, and possibly not too far off from the total from the Building Permit Survey.
Altogether, I think this information gives us a pretty clear picture of what new housing has been developed in Waltham. Full disclosure, I did not think I would be able to get this clear of a picture, but the city of Waltham has actually done a pretty good job of reporting on both the Building Permit Survey and in sending updated parcel maps to MassGIS. So, kudos to whomever is doing this reporting at city hall.
If we think this is a fairly accurate accounting of new housing production, what does this ultimately tell us about housing production in Waltham? Well, they’ve done more than nothing, and while several hundred units of housing over a few years is not particularly robust, it is significantly better than some other towns we come into contact with. The core issue here, and the issue that Tim Logan addresses in his article, is that we are not effectively thinking about housing in conjunction with economic growth. As Tim cites in his article, Waltham added 11,000 new jobs and only a few hundred housing units. We measured, and have verified here, that a few hundred is really more like several hundred units.
Should we expect every city and town to be able to house their entire workforce? Certainly not, and that is definitely not the argument being made by me or Tim Logan. For me, the story here is that we can’t plan for economic growth and housing growth effectively on the town level alone, but that’s exactly what we do. When all towns chase economic growth and spurn housing development, we are left with a region that experiences high demand for housing and insufficient housing supply. How do we ensure that we have the healthy housing market we need to continue to support our economy and foster healthy, inclusive communities when we can’t seem to plan in a coordinated way across town borders? Furthermore, on the topic of inclusivity, it’s notable that a fairly high proportion of new units in Waltham are luxury units. The value of this to the general public and average household could, and should be debated. Waltham is a prime example of how, left to their own devices, many cities and towns will pursue job growth and neglect a diverse set of housing needs. This is a big part of why we have a housing crisis.
Special thanks to MassGIS and UMass Donahue Institute for making the data used for this exercise readily available.
(Tom Hopper is co-director of MHP's Center for Housing Data. Tom has a bachelor’s degree in economics and a master’s degree in city planning from Boston University, and is pursuing a second master's in urban informatics from Northeastern University).