(Foreclosure Monitor is an effort by MHP to help public officials determine how best to use their resources to help homeowners and neighborhoods hard-hit by foreclosure).
By Tim Davis
BOSTON, Aug. 20, 2014 --- In the last year, the Commonwealth's rate of distress dropped from 7.1 units per 1,000 housing units to 4.0 units per 1,000 housing units. Boston was the big bright spot, outperforming the state with a 55 percent drop in distress.
The overall story in the state’s 26 gateway cities is similar as these communities combined for a 46.2 percent decline in distress over the last year. Recovery in these cities has been uneven, as some communities are still struggling (see next section).
The remainder of the state’s suburban and rural areas are seeing a smaller decline of 40.1 percent. Given the relative improvement in Boston and the gateway communities, the percentage of distressed housing units in Massachusetts’ suburban and rural areas increased from 51.6 percent to 54.8 percent of the total.
Although the picture of distress has improved dramatically since one year ago, Massachusetts foreclosure distress has increased a small 4.5 percent since April due to the recent increase in foreclosure petitions. Foreclosure Monitor has kept an eye on the recent increases in petitions, and it is clear that:
1) these petitions largely are being filed on mortgages made before the recession and represent the last stages of the “clean-up” from the sub-prime crises;
2) more petitions are being resolved by sales before the foreclosure, resulting in fewer abandoned or bank-owned properties.
Foreclosure Monitor defines properties in distress as those one- to three-unit properties where a foreclosure petition has been filed or an auction scheduled in the previous year, or the property has been bank owned (REO), for up to two years.
Foreclosure distress declines in all 26 gateway communities
Table 1 outlines foreclosure distress for Massachusetts’ 26 gateway communities. These communities represent just 26.7 percent of the state's housing units, but account for 39.5 percent of the state's foreclosure distress. In addition, the gateway communities have an overall distress rate that is 48 percent higher than the state's.
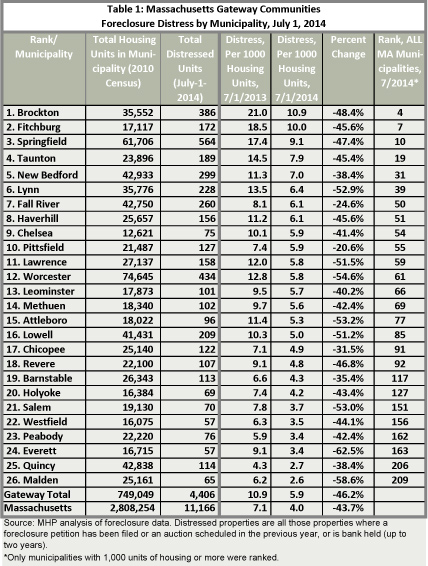
For the fifth quarter in a row, all 26 communities saw year-over-year declines in distress. The largest decline was in Everett (-63 percent), followed by Malden (-59 percent), and Worcester (-55 percent). The smallest declines were in Pittsfield (-21 percent) and Fall River (-25 percent). Six of these communities (Salem, Westfield, Peabody, Everett, Quincy, and Malden) have rates of distress that are lower than the state as a whole.
Brockton was dislodged from its spot as the municipality with the highest rate of foreclosure distress last quarter. Given continued improvement, Brockton now has the fourth highest foreclosure distress rate among all Massachusetts municipalities, though it remains the most distressed of the gateway communities. In addition to Brockton, three other gateway communities (Springfield, Fitchburg, and Taunton) remain among the state’s 30 most distressed municipalities, down from four in the last quarter.
30 most distressed Gateway tracts limited to 9 cities
As the number of housing units in each gateway city can vary dramatically, it's useful to analyze distress by census tracts, which generally range from 1,000 to 3,000 units. This helps provide state and local leaders with a better idea of exactly where property distress and neighborhood destabilization may be occurring and where public resources may have the most impact.
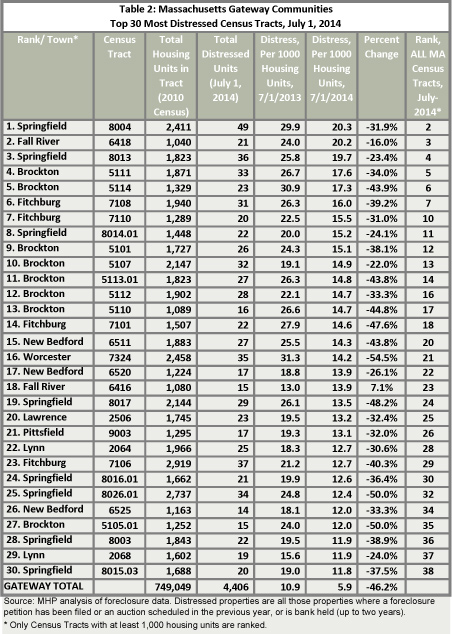
According to our analysis, as of July 1, 2014 the 30 most distressed census tracts in the state's gateway cities were limited to just nine cities, and 20 of these 30 are located in just three cities: Springfield, Brockton, and Fitchburg. Twenty-four of these tracts were among the state's 30 most distressed census tracts. This is a notable change from July 2013, when all 30 of the state’s most distressed tracts were in gateway communities (see Table 2).
Among the facts this table shows are:
• Brockton and Springfield have the most tracts in the top 30 (eight). This represents no change for Springfield, but last quarter Brockton had 12 tracts in the top 30.
• Distress declined in every tract except one—Fall River’s 6416 (a seven percent increase).
• The biggest decline in distress was in Worcester’s tract 7324 (-55 percent).
• Three communities had only one tract in the top 30 (Lawrence, Pittsfield, and Worcester).
All of the census tracts in this table have distress rates that are at least twice that of the gateway communities as a whole.
Boston distress rate improving faster than state
The overall distress rate in Boston as of July 1, 2014 was 2.3 units per 1,000 housing units, below the statewide rate of 4.0 per 1,000 units. Compared to a year ago, Boston's distress rate has declined 55.0 percent, faster than the statewide decline of 43.7 percent.
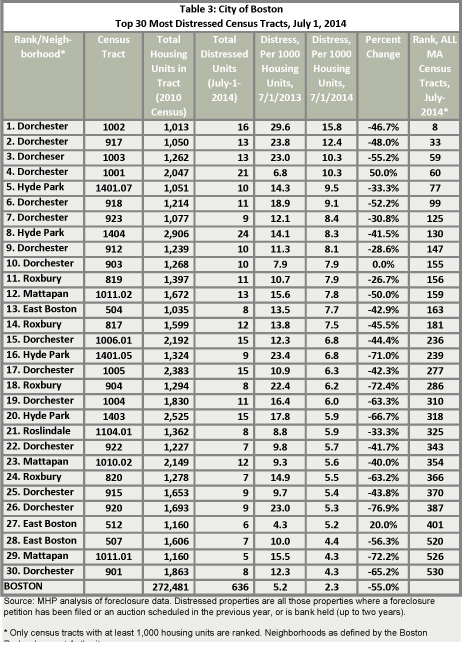
Foreclosure hotspots remain, however, especially when you consider that there are nine census tracts where foreclosure distress is more than twice the statewide rate (4.0 units per 1,000 housing units). Table 3 above provides detailed information on these tracts and the remainder of the 30 most distressed tracts in Boston. By neighborhood, the breakdown of these tracts was: 15 tracts in Dorchester, four tracts each in Hyde Park and Roxbury, three tracts each in Mattapan and East Boston, and one tract in Roslindale.
Only one Boston tract is in the statewide top 30 tracts, down from three on April 1, 2014. Indeed, only the top six tracts rank in the top 100 statewide.
Distress in suburban and rural communities
While the Foreclosure Monitor focuses on Massachusetts' most distressed urban neighborhoods, it is also important to note areas of distress elsewhere in the state. Of Massachusetts’ suburban and rural municipalities, the 30 most distressed are presented in Table 4.
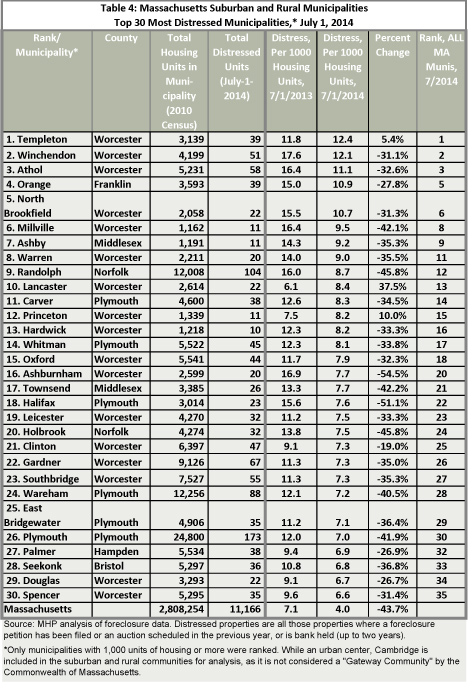
Combined, these 30 communities contain 1,245 units in foreclosure distress, compared to the 1,200 in Boston and Springfield, combined. Of these top 30 most distressed, 27 had a decline in distress from July 2013 to July 2014. Three communities had an increase in distress: Templeton (5.4 percent), Princeton (10.0 percent), and Lancaster (37.5 percent). The most distressed municipalities continue to be concentrated in Central and Southeastern Massachusetts.
Of these 30 municipalities, 21 are located in central Massachusetts’ Worcester County, or are immediately adjacent to Worcester County. The remaining nine are located on the South Shore or southeastern Massachusetts. These two areas have and should continue to contain the largest concentrations on distressed properties among the state’s rural and urban communities.
Other trends in real estate, foreclosures
The following links are provided for readers to directly access regular sources of foreclosure and real estate trends:
• Real estate sales volumes and prices: The Warren Group and the Massachusetts Association of Realtors (MAR) recently released their monthly real estate sales figures. The two use somewhat different data sets for analysis. The Warren Group reported a 3.7 percent increase in the number of single family sales from June 2013 to June 2014, and a 2.8 percent increase in median single family sales prices, while the Mass. Association of Realtors reported a small, 1.5 percent decline in the sales volume, and a 4.0 percent increase in median single-family sales prices. Both sources state that low inventory is contributing to the increase in prices. MAR data suggests inventory improved in May and June for single family homes, but remains very tight for condominiums.
S&P Case-Schiller Price Index recently released its May 2014 data. Prices continue to rise, with a 9.3 percent increase from May 2013 to May 2014, for its 20-city composite. Prices increased in all 20 cities, and prices increased 8.2 percent in Greater Boston, placing Boston 14th of the 20 cities measured (tied with both Denver and Phoenix).
The smallest price increases were in Cleveland (2.4 percent), Charlotte (4.7 percent), and New York (4.8 percent). The biggest annual price increases were in Las Vegas (16.9 percent) and San Francisco (15.4 percent), continuing a pattern seen over much of the last year. Annual price increase are, however, generally more moderate than in the spring.
For the 20-city composite, prices have not yet recovered to the pre-recession peak, but two of these cities, Dallas and Denver, have fully recovered, and prices in these two cities are now at record highs. Prices in the remaining 18 cities have not fully recovered, though Boston and Charlotte have recovered the most.
For Boston, prices are only 2.9 percent below the pre-recession peak. At the other end of spectrum, Las Vegas’s prices remain 43.2 percent below the previous peak. The June 2011 edition of the Foreclosure Monitor predicted that Greater Boston home values would recover sometime in mid- to late-2014. This prediction was based in part on how long it took the region to recover from the previous major housing recession (60 months), in the early 1990s. Given recent price increase, it appears that this prediction was on target (see Chart 1).
• Foreclosures and Negative Equity: CoreLogic recently released June foreclosure statistics. The foreclosure inventory (properties in the foreclosure process) in Massachusetts is 1.1 percent of mortgaged properties, a 39 percent decline from the year before. This rate is lower than the nation as a whole (1.7 percent), or any other northeastern state, except New Hampshire (0.8 percent). In addition, CoreLogic reported that 4.2 percent of Massachusetts mortgage loans were seriously delinquent, comparable to the national rate of 4.3 percent.
The Warren Group has released its June foreclosure data. Foreclosure petitions increased 99 percent from June 2013 to June 2014, from 245 petitions to 488 petitions. Despite this increase from a year ago, this is the first time since Feb. that there were fewer than 500 petitions.
Foreclosure deeds declined 19 percent over the same period, from 329 to 268. In March, April, and May, there were fewer than 200 foreclosure deeds each month. While some turn around could be expected given the recent increase in foreclosure petitions, a look at the data reveals that the June data may be inflated by a number of foreclosures related to a single development project in North Attleboro that contained a number of parcels. In this respect, July foreclosure deeds could again be less than 200.
Even though petitions are higher than a year ago, homeowners facing financial stress are more likely to sell a home before the foreclosure is completed if they have positive equity, and those with negative equity are those at risk for foreclosure. In CoreLogic’s most recent negative equity report (Q1 2014), 10.7 percent of Massachusetts homeowners with a mortgage have negative equity, down from 15 percent the year before. The national negative equity rate is 12.7 percent, an improvement from 20.2 percent in Q1 2013. While Massachusetts’ improvement is notable, half of the states have negative equity rates that are lower.
(Tim Davis is an independent research consultant commissioned by MHP to do foreclosure analysis and the Foreclosure Monitor).