This is the fifth edition of the Housing Stability Monitor and will explore data through June 2025.
Posted on August 26, 2025
By Matija Jankovic at MHP’s Center for Housing Data
Over the last four years, MHP’s Center for Housing Data has been researching and reporting on housing stability in Massachusetts. Amid fluctuating unemployment rates, wavering legal protections, changes to crucial support systems, and ever-growing rents and home sale prices, trends in eviction and foreclosure rates in the Commonwealth deserve regular attention.
During the pandemic, MHP established an internal Eviction and Foreclosure Task Force, bringing together staff from across our organization to compile data on eviction and foreclosure rates, discuss changes to key policies and supportive programs, and brainstorm opportunities to better support renters and homeowners across the state. To date, the Center for Housing Data has released four editions of the Housing Stability Monitor highlighting eviction and foreclosure data across the state’s 351 municipalities. This edition also features a special report on growing homelessness amid elevated eviction filing rates and ongoing shelter capacity concerns.
We are committed to making this critical data public and releasing quarterly editions of this research. Prior editions are available for download below, and this edition showcases the latest available housing stability data – we encourage you to explore the latest eviction and foreclosure trends to see how your community has been affected.
EVICTION TRENDS
Key Takeaways:
- Eviction filings remain elevated above the pre-pandemic average of 2,600 total filings per month, fluctuating between 3,000 and 3,500 in recent months.
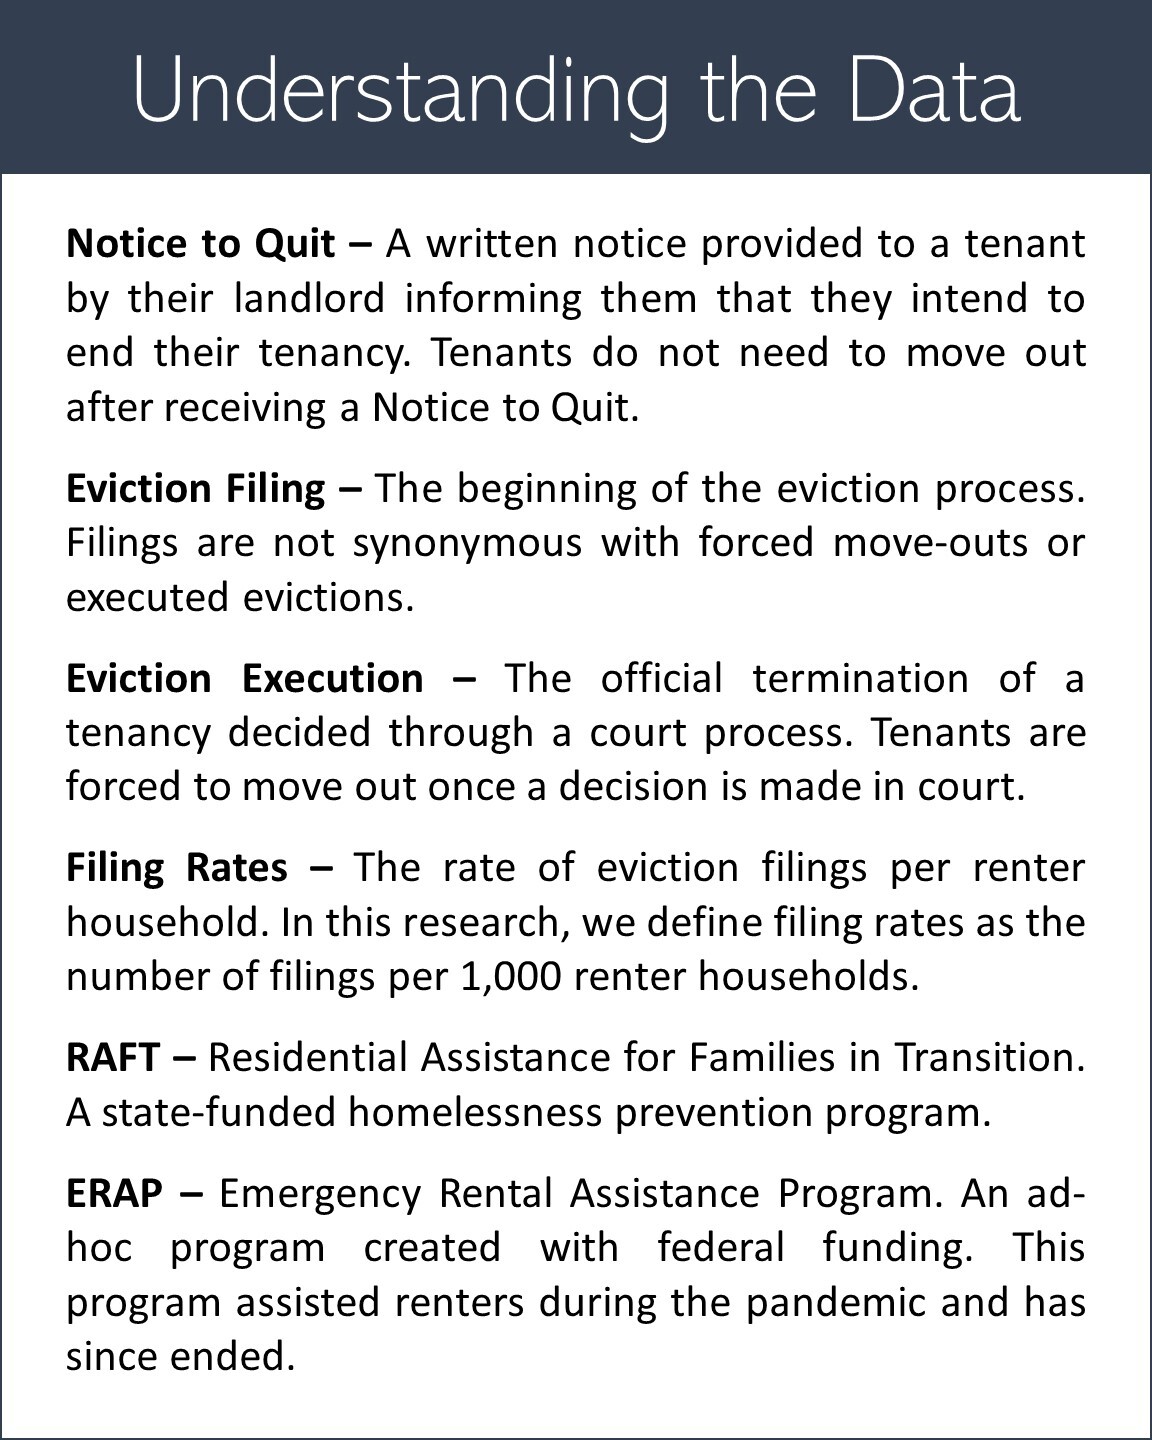
- The beginning of the period of heightened evictions coincides with the August 2022 decision to reinstate the “Notice to Quit” requirement for Residential Assistance for Families in Transition (RAFT) applications. The absence of the federally-funded Emergency Rental Assistance Program (ERAP), which ended several months prior in April 2022, may have also contributed to increased filings.
- Eviction filings for non-payment of rent make up roughly three quarters of all eviction filings.
- Cause and no-fault eviction filings make up roughly one quarter of all eviction filings.
Additional Context:
Eviction filings in Massachusetts remain elevated in recent months, with an average of 3,073 monthly filings between January and June of 2025. Non-payment evictions continue to make up roughly three quarters (72.1 percent) of eviction filings over the six-month study period while cause and no-fault evictions make up just over a quarter (26.9 percent). Eviction filing data shows that cause evictions are slightly more common than no-fault evictions, accounting for 15 percent of all filings compared to no-fault’s 11.9 percent. Elevated levels of eviction filings have persisted for over two years from August 2022 through the present, coinciding with two major shifts in eviction diversion efforts in Massachusetts: the closure of the Emergency Rental Assistance Program (ERAP) in April 2022, and the decision to reinstate the “Notice to Quit” requirement for the Residential Assistance for Families in Transition (RAFT) program in August 2022. In the two-year period that followed these changes in eviction diversion efforts, Massachusetts tenants have experienced elevated and sustained levels of housing instability, with eviction filings averaging over 3,000 monthly, surpassing the pre-pandemic norm of 2,600 monthly filings.
Heightened eviction filing levels are indicative of a housing ecosystem that is failing to meet the needs of Massachusetts residents. This includes market dynamics, such as inadequate housing supply and high prices, as well as shifting state and federal commitments to programs and interventions that keep people affordably housed. At the federal level, funding for Section 8 has remained stagnant despite increases in market rents across the nation, causing most housing authorities in Massachusetts to stop issuing new Section 8 vouchers to low-income residents. Since many jobs fail to pay a living wage, any reduction in housing subsidies will result in more households struggling to keep up with rent.
Meanwhile, on the housing supply side, in addition to the ongoing challenges to housing production identified in the Unlocking Housing Production Commission's Building Momentum Report, new challenges such as the federal government’s aggressive tariff policy haves increased construction material costs and timelines, which changes the financial feasibility of new developments. Combined with high interest rates, a shortage of construction workers, and some of the most expensive land prices in the country, it is becoming more difficult to meet our housing needs and provide affordable and attainable housing options. Given these dynamics, it’s not surprising that a 2024 National Movers Study found that Massachusetts ranks fifth among all states in outmigration, with movers citing the desire for affordability without sacrificing quality of life.
Given the aforementioned policy trajectory and uncertain market headwinds, there is no indication these trends will improve in the coming months; the data team will continue to monitor these trends and advocate for policies and initiatives that better support families impacted by our ongoing housing crisis.
Regional Trends:
Key Takeaways:
- The statewide rate of eviction filings was roughly 16.9 filings per thousand renter households between January 2025 and June 2025.
- Among all cities with more than 2,500 renter households, Randolph continues to have the highest eviction filing rate with 41.5 eviction filings per 1,000 renter households across the latest six-month period; this rate is more than double the statewide average.
- Other cities with notable filing rates include Springfield (35.0), Framingham (32.0), Burlington (29.4), and Lynn (29.2).
- Hampden County leads the state in filing rates, with 25.0 filings per 1,000 renter households countywide.
- Other notable regions with high rates include the greater Brockton area, Plymouth County, and the greater Lowell area.
Additional Context:
As noted in the previous edition of the Housing Stability Monitor, Randolph continues to lead all cities with more than 2,500 renter households in the rate of eviction filings with 41.5 filings per thousand renter households, more than double the statewide average. While the eviction filing data used for this analysis does not include demographic information on individual households, it is relevant to note that Randolph has the highest percentage of Black renters of any municipality in Massachusetts; Black renters make up roughly 53 percent of all renter households in Randolph, according to 2023 American Community Survey data. Moreover, over 59 percent of renter households are rent burdened, meaning they pay over 30 percent of their income towards rent. A quarter of Randolph renter households are severely rent burdened, paying over half of their income on rent.
In the six-month study period, we observed concentrations of eviction filings in the greater Brockton area, greater Lowell, and greater Springfield, along with other Gateway Cities. Other notable cities include Wareham, Pittsfield, Athol, While housing costs are on the rise across the state, recent reports suggest that soaring rents in the Greater Boston region are leading more renters in the inner core to relocate to farther out Gateway Cities due to their lower housing costs and accessibility to commuter rail; outward migration, however, has been cited as a major driver of rent prices in the Gateways, including Brockton, Lowell, New Bedford, Fall River, and Lynn, putting cost pressure on new and existing residents alike and leading to higher rates of displacement and homelessness.
Hampden County leads Massachusetts with the highest eviction filing rate over a six-month period with 25.0 filings per thousand renter households, 42 percent higher than the statewide average of 16.9 filings per thousand renter households. Since our last report, Hampden County has seen an increase in filings driven by greater numbers of filings in Holyoke and Springfield. Our research has paid particular attention to Hampden County, which previously experienced significantly lower rates of filings in 2020 and 2021 due to the commendable efforts of local non-profit and state actors that disbursed rental assistance funding to households in need at some of the highest rates in the state. As eviction diversion resources made available early in the pandemic have been discontinued, these supportive organizations no longer have the same capacity to stave off eviction pressures.
Eviction Filings vs. Eviction Executions:
Key Takeaways:
- Eviction filings for non-payment of rent have increased significantly since August 2022, which has translated into an increase in non-payment executions. It is important to note that the number of eviction executions lags behind filings since the decision to move forward with an eviction goes through the courts, a process that can take several months after the initial filing.
- Monthly eviction execution levels for non-payment of rent have remained elevated between January and June of 2025, averaging 742 executions per month.
- These persistently elevated levels of executions are concerning given the limited availability of shelter placements for families experiencing homelessness.
Additional Context:
Eviction executions lag a few months behind filings due to the numerous steps between a landlord submitting an eviction filing and a court ruling whether to remove a tenant from their home. The data reflects this lag, as the increase in eviction filings starting in mid-2022 took months to translate to a noticeable spike in executions. As filings for non-payment have remained heightened for nearly two straight years, executions have followed suit, consistently reaching monthly totals of 700 to 800 executions. According to the latest available data from the Massachusetts Trial Court, the state saw an average of 742 monthly eviction executions between January and June of 2025. While some evicted households may be able to find new housing or move in with friends or family, others become unhoused. Massachusetts remains the only state in the nation with a state-level right-to-shelter law guaranteeing temporary shelter for families experiencing homelessness. However, with persistently elevated levels of eviction executions, the number of households that may need to access this crucial resource is growing monthly.
Eviction executions are the least favorable outcome in the eviction process. For tenants, simply having an eviction filed against them, even if the filing does not result in an actual eviction execution, can lead to difficulties down the line when applying for a new unit. When an eviction order is executed by the court and a household must move out, there are often few places to go; affordable housing options are scarce and often have long wait lists and having an eviction on your record can lead landlords to deny a lease application. While some households are able to find a new home and while there are options such as doubling up with friends or family, an eviction often brings households closer to homelessness.
Recent shifts in statewide legislation may provide some much-needed relief to Massachusetts residents. New eviction sealing measures, which came into effect in May 2025, are creating pathways for tenants to apply to get nonpayment and fault eviction records sealed after several years, which may remove some of the roadblocks for renters facing insecurity following an eviction order. However, evictions are not automatically sealed for tenants that meet the criteria laid out in the law. Rather, the burden of initiating the court record sealing process is on tenants, meaning that eviction records will remain publicly available if tenants do not take the required steps to remove them from their credit reports.
The new legislation is certainly a step in the right direction, creating pathways for tenants to seal no-fault, non-payment, cause, and dismissed cases from public records. The criteria for different filing types vary but generally require tenants to certify that they have had clean eviction records for between four and seven years depending on the nature of their case and to provide other contextual evidence for their inability to pay rent or otherwise meet the requirements of their lease agreement at the time of their eviction filing. Dismissed cases or cases where tenants received a favorable judgement can be immediately petitioned for sealing without notice to the landlord, and courts can grant the petition without holding a hearing. This has the potential to improve the prospects of the thousands of renters who are subject to eviction proceedings each month.
Additionally, a new law banning tenant-paid broker fees will take effect this September, and may help reduce the high up-front costs facing renters looking to move into new units. Rental vacancy rates also appear to be on the rise, according to the latest Housing Vacancies and Homeownership survey. Massachusetts rental vacancies are estimated to be between 3.4 percent and 6.6 percent, a slight increase from 3.2 percent in 2024. These higher vacancy rates more in line with long-term averages could reduce upward price pressures in the rental market and provide additional options for renters searching for affordable homes.
HOMELESSNESS TRENDS
While much of today’s discourse surrounding homelessness focuses on migrant families, elevated rates of homelessness are an ongoing crisis affecting both migrant and local populations. This analysis aims to illuminate the longer-term context behind today’s homelessness crisis rooted in growing housing instability which the Center for Housing Data team has been tracking and analyzing over the last four years.
Growing rates of homelessness have been a major topic of discussion both locally in Massachusetts and across the nation, with a particular focus on the influx of migrant families over the last several years. Trends in migration are deeply tied to political and economic instability in countries across the world and today’s situation is certainly not unique. In addition to being a draw for students, researchers, and others moving here opportunistically from abroad, Massachusetts has been one of many destinations across the US for asylum seekers, offering stability and supportive services to countless individuals and families fleeing dire conditions in their home countries. Regardless of their reason for arrival, immigrants have long been an important part of Massachusetts’ culture and economy. Our inability to make space for newcomers, coupled with the emergence of increasingly hostile and violent treatment of immigrants from residents and the government alike, is a threat to the viability of the Commonwealth.
Overall homelessness remains at the highest levels on record since 2007 with few signs of improvement since last year, as over 28,000 adults and children surveyed were experiencing homelessness this past January. As noted in prior editions, the total surveyed population experiencing homelessness increased by over 10,000 between January 2023 and January 2024 and nearly doubled since 2022. While the dramatic increase in homelessness from 2023 to 2024 can be partially attributed to the arrival of migrant families in Massachusetts and other parts of the country, 2025 shows a continuation of unprecedented levels of housing insecurity in our state.
These numbers come from the Point-in-Time (PIT) counts coordinated by the federal Department of Housing and Urban Development (HUD) and administered by local Continuums of Care across the country. The Continuums of Care (CoCs) are local or regional planning bodies that coordinate housing services and funding for individuals and families experiencing homelessness, both sheltered (ie in an emergency or temporary housing accomodation) and unsheltered (ie sleeping on the street, in a car, or another location unfit for human habitation). It is important to note that HUD has not released the official 2025 Point-in-Time count, but the Massachusetts Executive Office of Housing and Livable Communities (EOHLC) has compiled the internal Point-in-Time counts administered by local Continuums of Care and shared this data with our research team.
Homelessness is on the rise in many of the Gateway Cities. Across the 11 Continuums of Care in Massachusetts, Lynn CoC, Fall River CoC, and Worcester City & County CoC all saw increases in the total homeless population, with Worcester seeing the largest increase. Between 2024 and 2025, individuals experiencing homelessness in Worcester and the surrounding county increased from 1,927 to 2,864, a 48.6 percent increase. All other CoCs saw a decrease in total homelessness.
Unsheltered homelessness is the highest level in nearly two decades, with 1,748 individuals experiencing homelessness in January of this year. The state has made an effort to provide temporary shelter for over 26,000 individuals in Massachusetts at the time of the Point-in-Time survey; however, the growing number of adults and children experiencing unsheltered homelessness is a major point of concern. Across the state, Lynn CoC, Worcester City & County CoC, Berkshire, Franklin, & Hampshire County CoC, Fall River CoC, and Springfield & Hampden County CoC all saw increases in unsheltered homelessness.
The emergency shelter system has been at—or slightly below—capacity for over one full year since November 2023. Massachusetts has some of the most progressive policies on homelessness in the nation, most notably the right-to-shelter law enacted in 1983. For over four decades, this law has guaranteed placement in shelters or temporary accommodations (such as hotels) for families with children experiencing homelessness. However, in November 2023, the Emergency Assistance (EA) system reached its 7,500-household cap for the first time since the inception of the right-to-shelter law and these higher enrollment numbers became challenging for the state to accommodate.
In March of this year, the state reduced the emergency shelter system’s capacity to 5,800 households, with plans announced to reduce capacity to 4,000 by the end of the year. Moreover, since February of 2025, new time limits have been introduced to the EA Family Shelter system, requiring families to transition out of shelter within 6 months. While the goal of the shelter system has always been to move families into stable housing as efficiently as possible, there were no explicit limits on the duration of shelter stays prior to February. Given these changes, the reduction in sheltered homelessness portrayed on the chart may not indicate a reduced need for emergency shelter among Massachusetts families, but rather a reduction in overall shelter capacity. It is unclear from available reporting and tracking where households leaving the family shelter system have wound up. However, as demonstrated by the growing number of unsheltered homeless individuals and high eviction rates, the need for emergency housing support remains high.
Solving the present-day housing crisis requires improving housing outcomes for everyone living in Massachusetts through a focus on upstream support. While reactive, downstream programs such as the EA shelter program need greater capacity to address acute needs, a longer-term strategy to remove structural barriers will reduce hardships and alleviate demand pressure on emergency systems over time. These barriers include the constrained supply of new affordable housing, low production inhibited by restrictive zoning and exorbitant development costs, the absence of upstream (pre-Notice to Quit) rent relief funding and legal measures encouraging landlords to engage in alternative systems rather than pursuing eviction, and the scarcity of affordable units in subsidized and public housing. Focusing our efforts on these issues would reduce the strain on our Emergency Assistance system, which would allow us to provide better services to all families experiencing homelessness in Massachusetts and prevent more families from entering the system in the first place.
FORECLOSURE TRENDS
Key Takeaways:
- Statewide foreclosure petition levels have remained relatively stable with an average of 315 monthly petitions between January and June of 2025
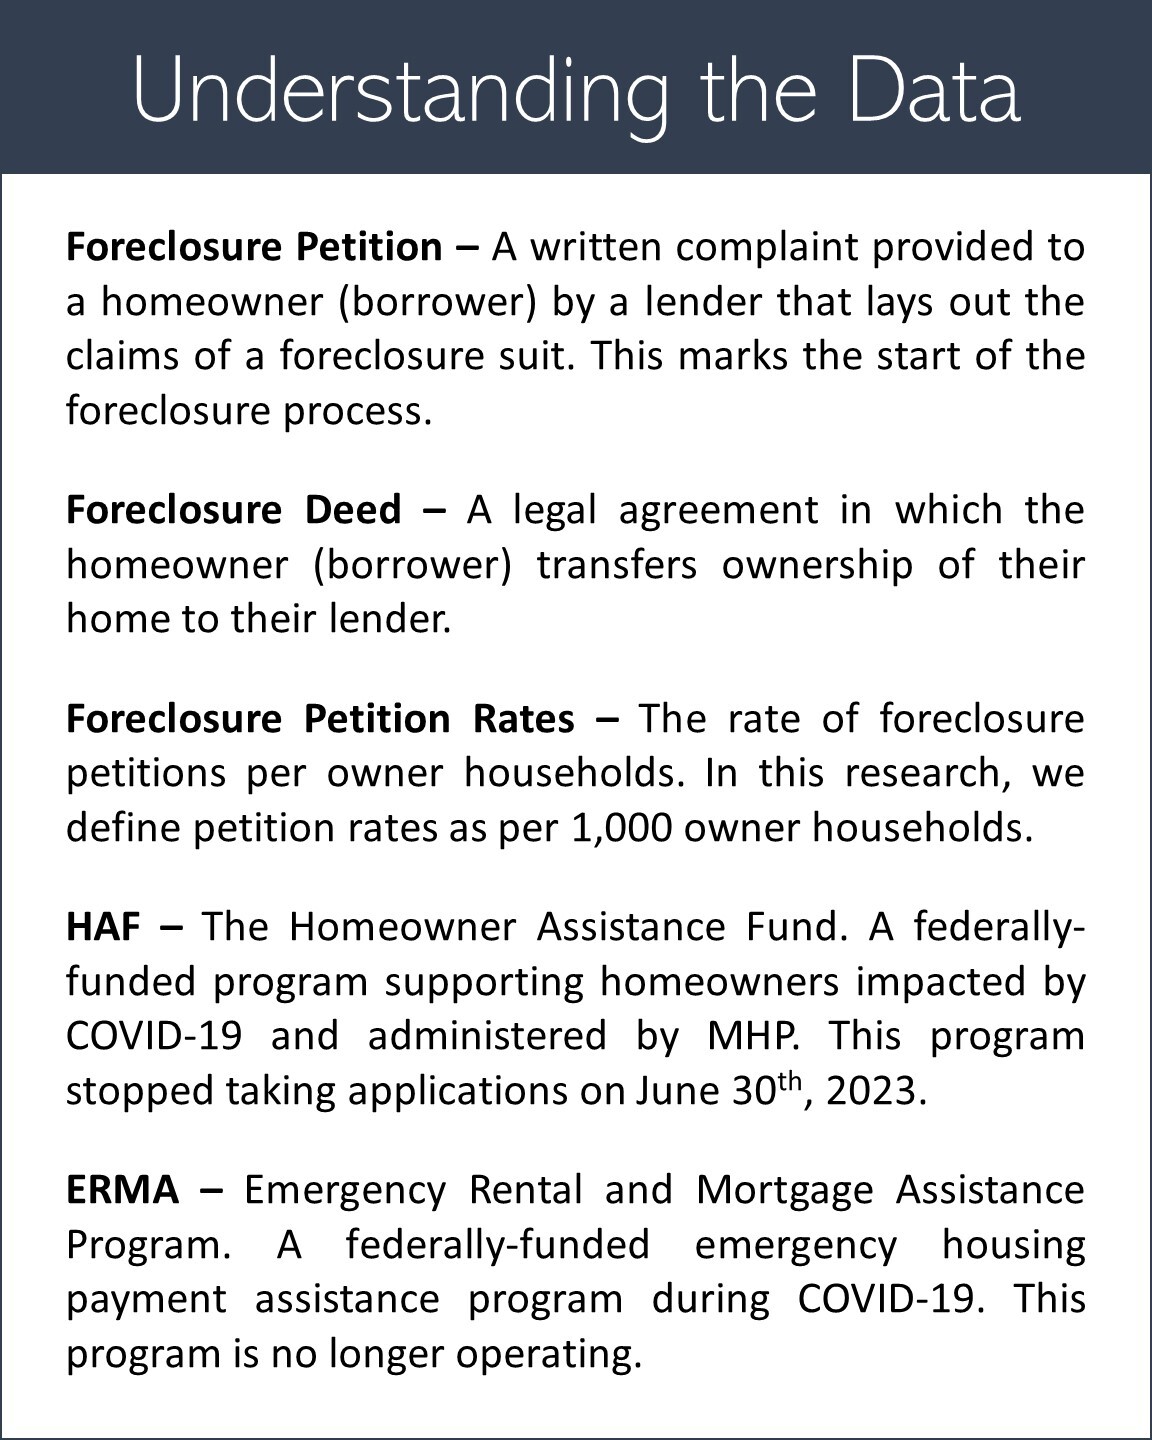
- We observed a slight uptick in petitions since July 2023 following the Homeownership Assistance Fund (HAF) program’s closing; however, these numbers are still below pre-pandemic rates.
- Foreclosure deed levels have remained low with an average of 80 per month over the six-month study period. This trend has persisted since the spring of 2020 with minimal spikes in foreclosure deeds.
Additional Context:
As noted in our previous analysis, foreclosure petition and deed levels have remained significantly lower than their pre-pandemic averages (roughly 530 petitions and 230 deeds monthly), largely due to the impact of the federal moratorium on foreclosures. These trends have continued post-moratorium, though we did observe a gradual increase in petitions to foreclose.
The federal Homeowner Assistance Fund (HAF), which supported over 6,000 Massachusetts households behind on mortgage payments to prevent foreclosures, stopped accepting new applications for mortgage assistance on June 30, 2023. We expected to see an increase in foreclosure petition rates following the end of HAF, particularly as previous data seemed to indicate an ongoing growth in filings. However, the latest data show a slight decrease in petitions to foreclose even as supportive programs are rolled back. Foreclosure deeds have also remained stable and well below pre-pandemic rates.
Currently, homeowners in need of assistance can still apply for funding through Massachusetts’ Residential Assistance for Families in Transition (RAFT) program, though these requests are limited to $7,000 or less; the average request for HAF applications was roughly $20,000. With the end of the HAF program, we will closely monitor foreclosure deeds and petitions for any changes in the coming months.
Regional Trends:
Key Takeaways:
- As noted previously, foreclosure rates have remained stable relative to pre-pandemic trends. At the regional level, foreclosure petition rates show some variability among municipalities and across county lines.
- The inner ring suburbs have notably low rates of foreclosure petitions.
- Hampden County leads all counties in Massachusetts in rates of foreclosure petitions (2.05 foreclosure petitions per 1,000 owner households county-wide), nearly double the statewide average of 1.13.
- Plymouth, Franklin and Bristol counties also rank among the highest in the state. (Plymouth: 1.51, Franklin: 1.38, Bristol: 1.38 foreclosure petitions per 1,000 owner households county-wide).
- Springfield leads all major cities (greater than 2,500 owner households) with 3.48 foreclosure petitions per 1,000 owner households and 100 foreclosure petitions between January and June of 2025.
Additional Context:
While foreclosure petition rates are relatively low across the state, the data show clear regional trends over the six-month study period. We observed relatively low rates of foreclosure petitions in the inner-ring suburbs surrounding Greater Boston, along with diminished petition rates in the Pioneer Valley suburbs outside Hampden County. In contrast, Hampden County leads the state with the highest rates of foreclosure petitions over the last six-month period. This is largely attributed to Springfield, which leads all big cities (cities with over 2,500 owner households) with 3.48 foreclosure petitions per 1,000 owner households. This rate is more than triple the statewide average of 1.13. Brockton trails closely behind Springfield with 3.30 foreclosure petitions per 1,000 households. Cities in the Greater Brockton region, including Stoughton (2.26) and Randolph (1.94) are also seeing higher rates of foreclosure petitions, significantly higher than the statewide average. This is particularly notable as these cities have also been experiencing higher rates of eviction filings, indicating broader housing instability trends affecting both renters and homeowners.
Statewide HAF disbursement data provided by MHP and MassHousing show cities across Massachusetts accessed HAF assistance at varying rates. Springfield, Boston, Brockton, and Worcester led all cities in total HAF assistance requests while the program was in operation, with Springfield leading by a sizeable margin. In the absence of HAF, we may see an increase in foreclosure petitions in specific cities that have relied on this key resource to prevent foreclosures. We encourage you to explore municipal trends through the searchable and filterable data table included below.
For questions related to eviction and foreclosure data in your community, or additional information about this brief, please contact Matija Jankovic.
For more information contact MHP Communication Manager Lisa Braxton, (857) 301-1526.
Eviction filing data is provided by MassLandlords Inc. and is available online at: https://masslandlords.net/policy/eviction-data/
Author's Note on Eviction Data: Statewide eviction data is particularly difficult to access through the Massachusetts Trial Court database, which creates unnecessary roadblocks to conducting research, such as this piece, to inform policy and provide a public benefit. This analysis is made possible thanks to the MassLandlords team’s diligent efforts in compiling community-level eviction filing data. However, we believe that efforts need to be made by state agencies and policymakers to ensure public access to housing stability data. The Center for Housing Data will continue to support these efforts in the coming year.
Foreclosure data is provided by The Warren Group.
PREVIOUS HOUSING STABILITY MONITOR RELEASES
FIRST EDITION – September 2023 (PDF)
SECOND EDITION – January 2024 (PDF)