Posted on September 20, 2019
BOSTON – You asked and we listened! MHP’s Center for Housing Data (CHD) team has added a major new feature to its DataTown website: the ability to easily select as many communities as you want to make data comparisons.
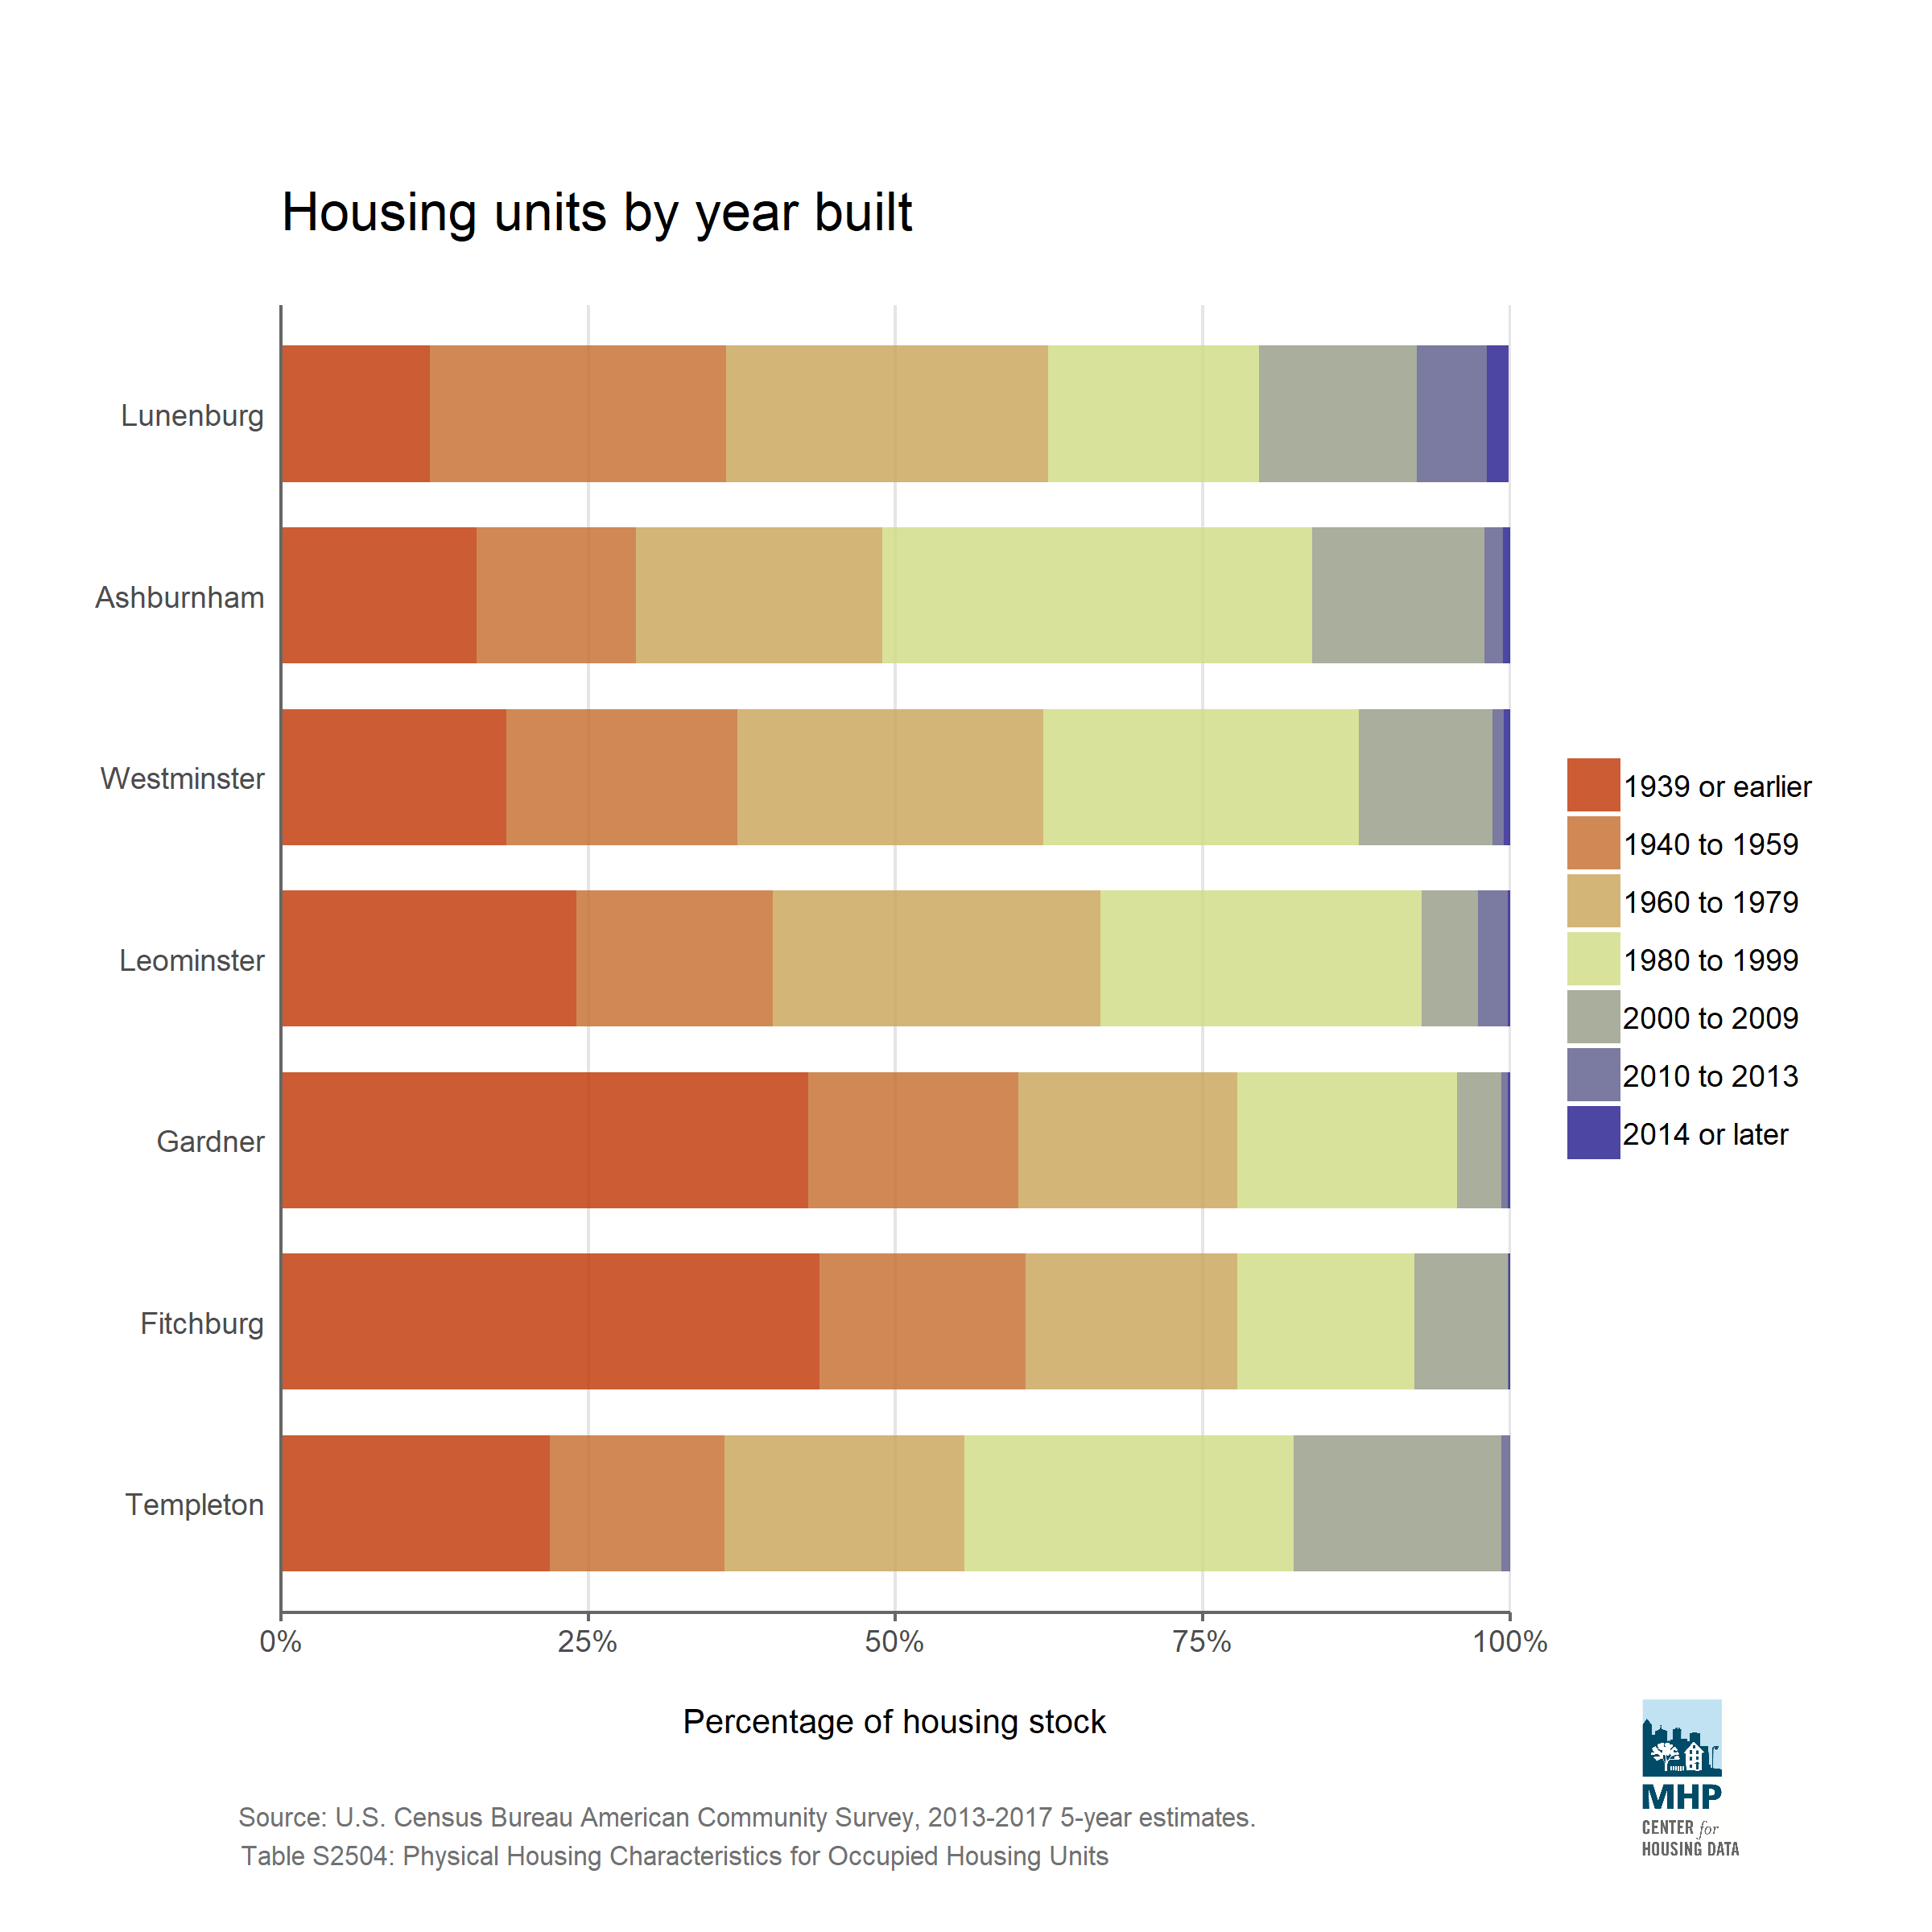
Launched in January 2019, DataTown compiles community-level information from various data sources for all 351 Massachusetts cities and towns, and visualizes that data in graphics and charts.
The site enables users to analyze town populations from many angles - population growth history, age demographics, income, tenure, affordability and racial composition. There are also sections that use data to illustrate housing inventory and production, and labor force (employment, commuting, occupations and industries).
Key features include graphics that can be easily downloaded, the option to download raw data, helpful coaching text, source explainers, and the ability to access multiple data sources on one web site.
After the January launch, DataTown users told us they wanted the ability to compare towns and build visualizations on how they differ.“DataTown was built to provide up-to-date information to help local leaders understand and explain what’s going on in their community," said Director of Research & Analytics Tom Hopper. “Almost immediately people asked for the ability to more easily compare communities. This new feature reinforces a hallmark of the site – you ask and we’ll try our best to deliver.”
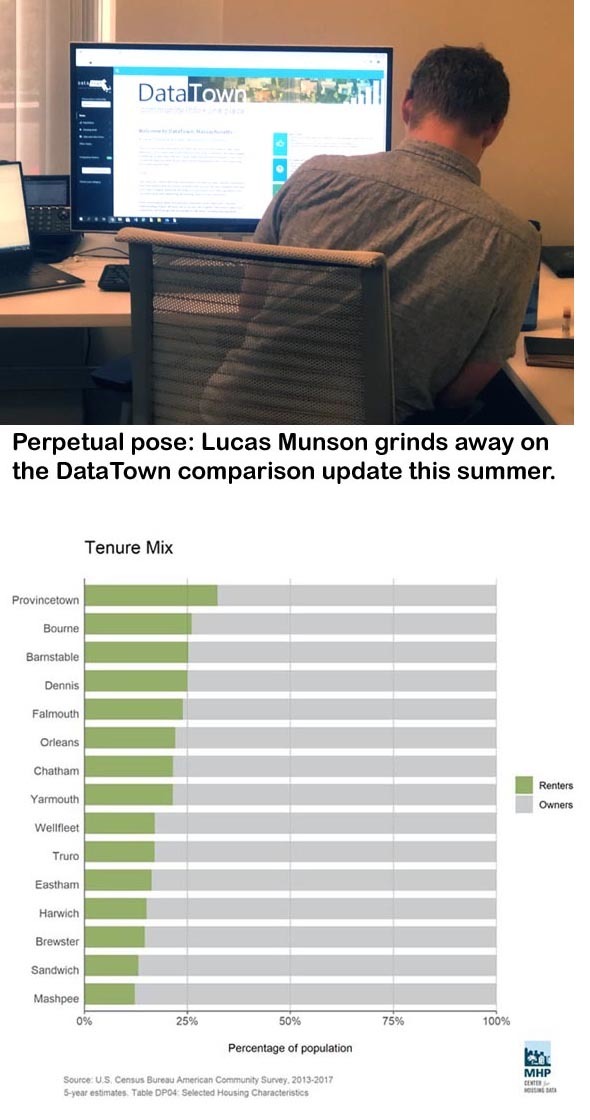
This update was due in large part to efforts by Policy Associate Lucas Munson. Munson spent the summer re-visualizing all the data compiled for every Massachusetts community. Because of his efforts, users can now visualize how communities compare in terms of demographics, housing production, housing type, cost burden and more.
MHP’s CHD team used R - an open source coding language for statistical computing and graphics - to create the website and its latest update. Munson worked closely with the RStudio Community whenever the coding did not result in an accurate and effective visualization of the data. “We were only able to finish this upgrade because of support from the R community with a heavy reliance on message boards and searches,” said Munson. “We’re very thankful for a community that shares so openly and freely.”
“We’re excited for this update to help enhance local conversations,” said Policy Director Callie Clark. “Now that you can make data comparisons with the click of a button, it’s easier to see trends and highlight what similarities, or differences, exist between communities."
The Center for Housing Data was created in 2017 to expand on MHP's efforts to promote policies to help the Commonwealth build more housing in response to demand. CHD was part of Governor Baker's interagency task force that created the Housing choice designation and grant program. The team was also one of the research teams behind The Boston Foundation’s Greater Boston Housing Report Card, released in June of this year.
Check DataTown out and let us know what you think of this enhancement. To make comments, suggestions or get more information, contact Lucas Munson at lmunson@mhp.net or follow us on Twitter @mhpdata.